dashboard
Beyond Market Intelligence keeps dashboard in one place: 9 stories so far. The section currently leads with “Navigate Contradictory Filters in DAX Without Empty Results”, “Why Your Slicer Colors Won't Stick in Pivot Charts”, and “When Tools Break, Your AI Agent Keeps Writing Confident Answers”. Contradictory filters in DAX usually mean empty results, but they don't have to. You've set your slicer so Yes shows orange and No shows green, but the chart stubbornly stays green no matter which button you press. Acme AI is the next-generation, AI-powered spreadsheet platform built to replace Excel and redefine how analysts, data scientists, and enterprise teams work… The list below is every dashboard story on Beyond Market Intelligence, newest first.
Navigate Contradictory Filters in DAX Without Empty Results
Contradictory filters in DAX usually mean empty results, but they don't have to. By rethinking the data model, you can calculate exactly what you need even when filters logically conflict. It's a practical fix that turns a frustrating limitation into a straightforward solution, no workarounds required. For a deeper look at how data shapes understanding, explore our related piece on how 600,000 newspaper pages reveal suffrage's shifting narrative.
Why Your Slicer Colors Won't Stick in Pivot Charts
You've set your slicer so Yes shows orange and No shows green, but the chart stubbornly stays green no matter which button you press. Clear the filter, and the colors snap back. This is a known pivot chart limitation: slicer selections don't always trigger the conditional formatting engine the same way a full filter reset does. For a practical workaround, consider using a helper column that maps your Yes/No values to distinct data points, then color those directly.
When Tools Break, Your AI Agent Keeps Writing Confident Answers
When a tool fails, most systems go silent. But an AI agent built for production doesn't stop, it keeps writing confident answers from nothing, even as the dashboard stays green. That resilience is the point. For a deeper look at keeping these agents reliable, our guide on adding practical guardrails with Gemma 4 and Ollama is a natural next step.
Maximize Your Power BI Pipeline Without Wasting Time on Dead Ends
You're right to question whether Excel VBA opening a file is the most reliable path, it often creates more dead ends than solutions. Power BI Premium with Copilot gives you a cleaner option: schedule a direct refresh through the service, or use Power Automate to trigger a refresh when a new CSV lands in SharePoint. Skip the Excel middleman entirely. Your data pipeline should flow forward, not loop through fragile workarounds.
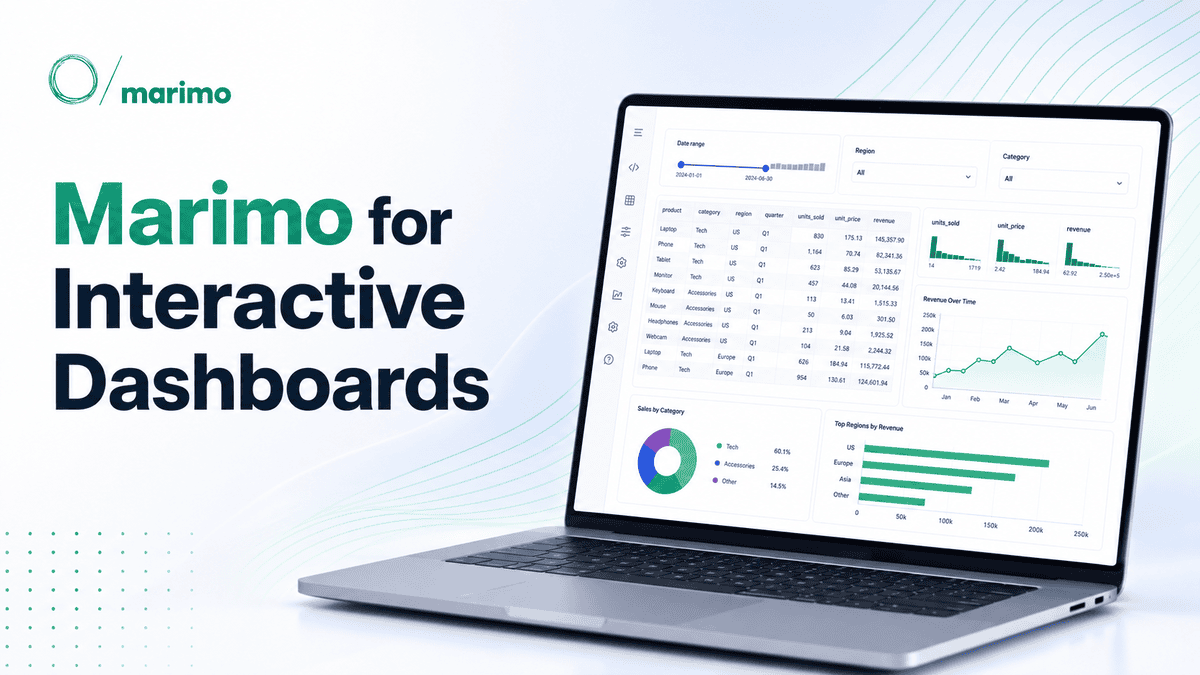
Build Interactive Dashboards Using Marimo's Reactive Notebooks
Spreadsheets weren't built for exploration, but Marimo's reactive notebooks are. This guide walks you through using Python, Pandas, and Altair to turn static analysis into an interactive dashboard you can actually share. We appreciate the focus on practicality, because data should respond to your questions, not the other way around. If you're curious how data representation shapes interpretation, our related piece, "How Many Stories Can Your Data Tell?" pairs well with this hands-on approach.

Explore Xiaomi’s MiMo-V2.6: AI Model Training Achieves $3.5M Benchmark
Xiaomi's MiMo-V2.6 just made a compelling case for efficiency in AI training, clocking in at a $3.5 million total RL cost. That's a number that invites a second look, especially when paired with a live benchmaxxing dashboard that puts the process on display. It's a practical, transparent approach to a field often shrouded in complexity. For those wrestling with how to evaluate such models, our piece on verifying your AI's understanding offers a timely starting point. This isn't about hype; it's about measurable progress.

Explore how Aspire 13.5 refines your workflow with smarter tools and clarity.
Last week's release of Aspire 13.5 feels less like a routine patch and more like a deliberate step toward a smoother developer experience. The refreshed dashboard and aspire.dev homepage are welcome, but the real value sits in the details: file imports and progress dialogs in the Interaction Service, interactive terminals for resources, and Kubernetes persistent volumes with cross-scope Azure references in deployment. These aren't flashy additions. They're practical, quality-of-life improvements that reduce friction.
When Your Art Inventory Outgrows Your Spreadsheet
Cataloguing four years of botanical illustrations sounds rewarding until your tidy columns start fighting back. That 300-row wall is familiar, and the commission versus shop-piece split is exactly where flat tables lose their shape. You are right to resist two separate sheets; that breaks the overview you need. A single table with a row-type flag, then SUMIFS or XLOOKUP for a dashboard, is the cleaner path. It keeps one source of truth while letting blanks exist where fields do not apply.

Give any website a direct voice for AI agents with one switch
A single dashboard switch is all it takes for any website to expose a WebMCP interface, letting browser-based AI agents work with structured tools instead of scraping blindly. Cloudflare's developer preview keeps human traffic and control on the original site, which feels like the right balance. It's a practical step toward making AI interactions cleaner without rewriting the web. For more on how AI touches everyday experiences, our piece on talking to an AI clone offers a thoughtful counterpoint.