data manipulation
data manipulation at Beyond Market Intelligence is a file of 6 stories. The newest of them: “Speed up pandas workflows with smarter, faster DataFrame processing.”, “Discover how to surface your most played decks from scattered date columns”, and “Filtered data shouldn't mean filtered control over your selections.”. If you've ever watched a pandas script crawl through a DataFrame, you know the frustration. Tracking down your most recently played decks across multiple date columns is a challenge Excel can handle, but it requires a smarter approach than a simple formula. Acme AI is the next-generation, AI-powered spreadsheet platform built to replace Excel and redefine how analysts, data scientists, and enterprise teams work… The list below is every data manipulation story on Beyond Market Intelligence, newest first.
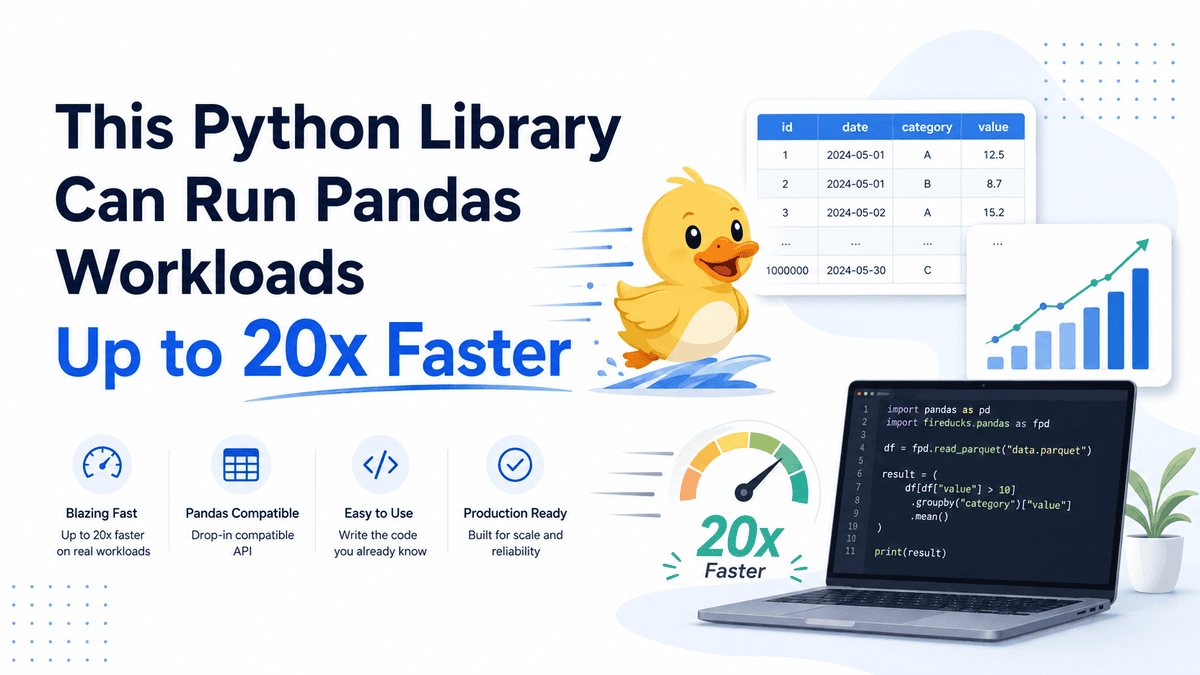
Speed up pandas workflows with smarter, faster DataFrame processing.
If you've ever watched a pandas script crawl through a DataFrame, you know the frustration. FireDucks takes that same workload and runs it up to 20 times faster. It achieves this through lazy execution, compiler optimization, and multithreaded processing, turning what feels like waiting into near-instant results. We find that shift genuinely exciting. For those ready to push their Python skills further, our guide on advanced coding techniques pairs perfectly with what FireDucks makes possible. Explore the benchmark and see the difference for yourself.
Discover how to surface your most played decks from scattered date columns
Tracking down your most recently played decks across multiple date columns is a challenge Excel can handle, but it requires a smarter approach than a simple formula. You are essentially asking Excel to scan every date column, rank them, and map the top ten to their respective decks. That is doable with a combination of `MAX`, `INDEX`, and `SORT` functions, or a pivot table if you restructure your data. It is a bit of a puzzle, but a rewarding one.
Filtered data shouldn't mean filtered control over your selections.
Click-dragging to select one column in a filtered sheet can feel like the spreadsheet is working against you. That jarring jump from a single column to a sprawling range is a classic friction point when dealing with large, inherited datasets. The issue usually boils down to hidden rows being included in the selection logic, not a broken setting. It is a frustrating snag, but it is solvable.
Take Control of Shared Spreadsheets with Smarter Sorting and Locking
Sorting through a shared spreadsheet can feel like herding data that refuses to stay put. This user's frustration with jumbled blocks and IDs after filtering is a familiar pain point for anyone collaborating in Excel via SharePoint. The core challenge isn't the sorting itself, it's keeping order intact once filters disappear. Locking Column A to preserve block order per student while allowing ID sorting is a smart, practical fix. It's about making the tool work for the workflow, not against it.

Choosing the Right Python Tool for Your Data Workflow
Not all Python data libraries are created equal, and the choice between Polars and Pandas often comes down to what you're actually building. For AI developers, the question isn't just about speed; it's about matching the tool to the task. Pandas offers familiarity and a mature ecosystem, while Polars brings performance gains that can matter at scale. We think the answer isn't a simple switch, but a careful evaluation of your workflow.

Stop optimizing speed and start reducing mental load in data work
Faster dataframe engines are a welcome upgrade, but they sidestep a deeper issue. The real bottleneck isn't speed; it's the sheer volume of syntax an analyst must hold in their head. pandas demands constant mental juggling, and no performance boost lightens that load. We should be designing tools that reduce cognitive friction, not just processing time. For a broader look at how we think about technical trade-offs, our piece on the Forrester function offers a useful parallel.