probability
probability at Beyond Market Intelligence is a file of 6 stories. The newest of them: “From Loot to Logic: Build Your Own Probability Tracker”, “Stop Misreading Your Data How Confidence Intervals Shape Decisions”, and “Discover how Stanford pairs one mentor with every ten learners in AI”. Building a statistical cheat sheet for loot probability is a smart way to turn frustration into clarity. Most of us assume that a 95% confidence interval means there's a 95% chance the true value lies within it. Acme AI is the next-generation, AI-powered spreadsheet platform built to replace Excel and redefine how analysts, data scientists, and enterprise teams work… The list below is every probability story on Beyond Market Intelligence, newest first.
From Loot to Logic: Build Your Own Probability Tracker
Building a statistical cheat sheet for loot probability is a smart way to turn frustration into clarity. The user's plan to map binomial distributions onto reroll costs is practical, and the percentile overview idea adds real insight. The main hurdle is linking cost scaling to roll counts, but that's solvable with a lookup table. For a deeper dive into adaptive systems that handle variable outcomes, check out "Evolve Your Recommendations: Real-World Insights on Adaptive Systems.

Stop Misreading Your Data How Confidence Intervals Shape Decisions
Most of us assume that a 95% confidence interval means there's a 95% chance the true value lies within it. That's the illusion. This piece unpacks that confusion, clarifying how frequentist intervals and Bayesian credible intervals answer fundamentally different questions. It's a sharp, practical warning: misuse these tools, and you'll distort product decisions. For those eager to keep sharpening analytical instincts, the discussion pairs well with insights from our piece on adaptive systems, where similar precision matters in recommendation design.
Discover how Stanford pairs one mentor with every ten learners in AI
When Chris Piech, a Stanford professor in the AI lab, launched Probability for AI, he aimed for something different: a class where one volunteer teacher supports every ten students. That is a bold ratio, and the response has been telling, with over 1,000 people applying to teach within the first week. Piech is also building tools to make assignments approachable, like a text detection app you can create after just an hour of learning.
Explore how a simple model estimates NeurIPS acceptance from your scores.
A quick, practical tool just landed for anyone tired of refreshing review portals. A Reddit user built a small model that estimates NeurIPS acceptance odds from scores and an assumed acceptance rate. It is a simple calculator, not a crystal ball, but it gives researchers a useful sense of where they stand before decisions land. That sort of accessible, data-driven clarity is exactly what the future of academic tools should look like.
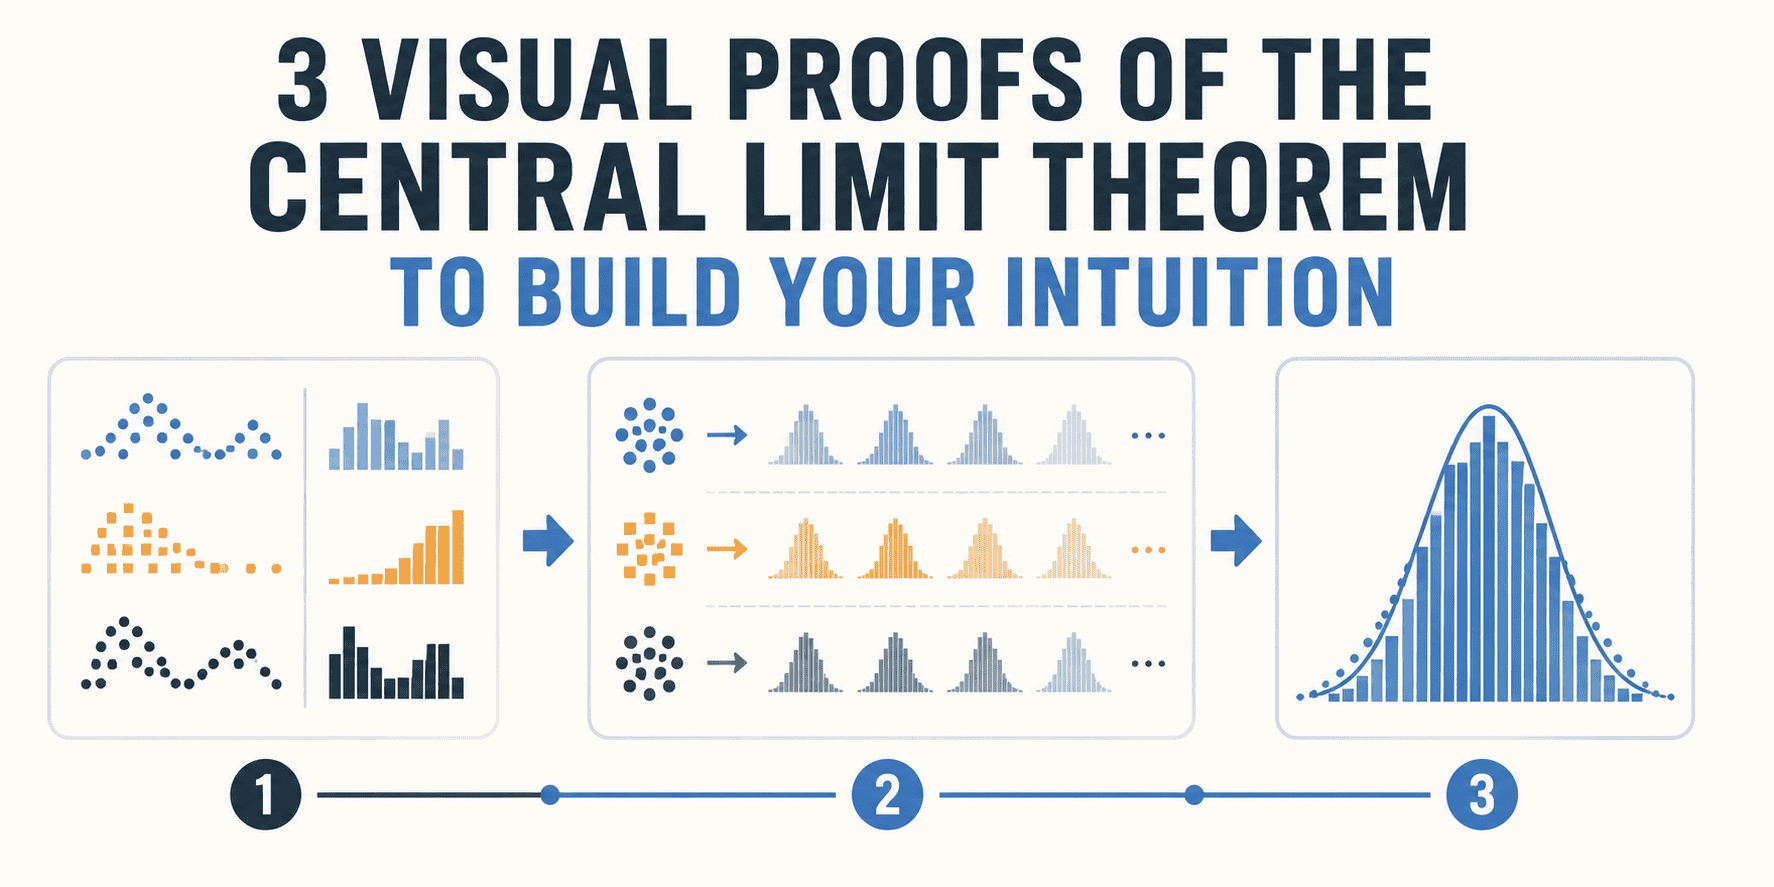
See How Three Visual Proofs Reveal the Central Limit Theorem
The bell curve's ubiquity can feel like magic, but it's pure mathematics. Three visual proofs of the Central Limit Theorem show how the classic shape emerges from everything from dice rolls to sample means. Rather than leaning on dense formulas, these visuals make the concept click in a way that sticks. If you're building statistical intuition for a broader data science journey, this is a practical starting point.
From Academia to Impact: Translating Public Health Expertise into Industry
Four years in academia, with publications in JAMA Open and experience in doubly robust methods, gives you a real analytical foundation. That is not the problem. The gap is likely in how you are framing your transition. You are studying SQL and probability, which is good, but you need to show how your causal inference work solves business problems. Frame your research as applied decision-making. Also, revisit that tech internship network; it is your strongest asset.