data transformation
19 stories filed under data transformation on Beyond Market Intelligence. The newest of them: “Transform scattered data into clean columns with AI-powered simplicity.”, “Dropbox's Riviera Platform Expands to Power AI Workflows at Scale”, and “Turn rows of data into columns with one intelligent move”. Splitting a column in Power Query sounds simple until the data refuses to cooperate. Dropbox has quietly turned Riviera into something far more useful than a file preview tool. Acme AI is the next-generation, AI-powered spreadsheet platform built to replace Excel and redefine how analysts, data scientists, and enterprise teams work… The list below is every data transformation story on Beyond Market Intelligence, newest first.
Transform scattered data into clean columns with AI-powered simplicity.
Splitting a column in Power Query sounds simple until the data refuses to cooperate. This user's challenge with "Ball 23/Bat 25/Hoop 12/Club 17" is a classic: the goal isn't just separating text, but mapping each item to its own column without losing the associated numbers. Conditional columns feel logical, yet they often miss the mark when values vary. The trick isn't forcing a pivot; it's a structured split-and-group approach. For anyone wrestling similar multi-value cells, patience and a step-by-step transformation strategy make all the difference.

Dropbox's Riviera Platform Expands to Power AI Workflows at Scale
Dropbox has quietly turned Riviera into something far more useful than a file preview tool. The platform now processes over 300 formats and 100 transformation capabilities, handling hundreds of thousands of operations per second. That scale matters for teams feeding AI workflows that need reliable, asynchronous content extraction. Riviera's expansion into Search, Sign, and Dash shows a clear understanding of what modern data work demands. If you're navigating similar infrastructure decisions, our piece on real-world computer vision deployments offers practical context worth exploring.
Turn rows of data into columns with one intelligent move
Manually transposing 385 spreadsheets is a recipe for burnout, especially when the fields you need are always in the same spots. This isn't a skill problem; it's a tool problem. The request is simple, but the repetition makes it painfully inefficient. Automating this with a script is the only sane path forward, and it's worth exploring a solution that turns this tedious chore into a one-click win.
Turn scattered referral data into one clear monthly view.
Merging multiple tables that share an X axis but carry different Y axes is a familiar wall for anyone wrestling with monthly referral data. The manual route works, but it's tedious and prone to error, especially when you're juggling several sources. What you're describing isn't just about efficiency; it's about reclaiming time for analysis over assembly. Tools like pivot tables or a simple script can handle this transformation cleanly. For those exploring broader data-shaping ideas, our piece on TanStack Charts touches on flexible visualization approaches.
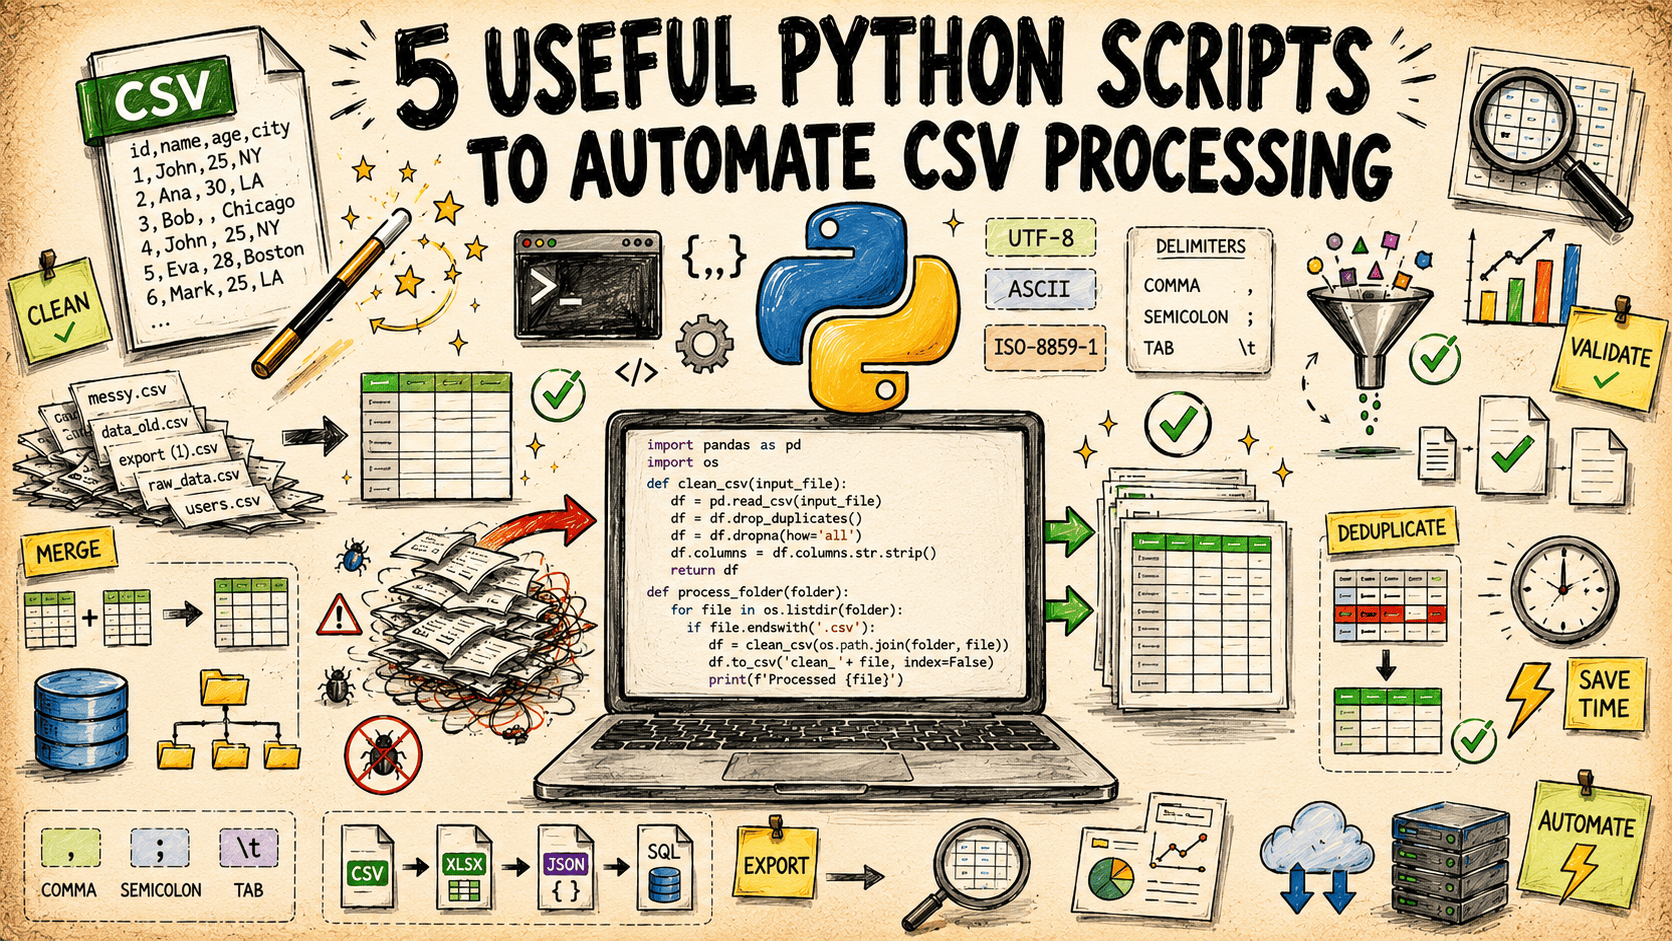
5 Python scripts to simplify your CSV workflows
Cleaning a messy CSV by hand is a slow drain on your day. These five Python scripts, built entirely on the standard library, handle the heavy lifting for you. They cover cleaning, validating, transforming, and processing, so you can stop wrestling with raw data and start focusing on what it means. It is a practical, no-fuss approach to automation. If you are looking to sharpen your coding fundamentals, our guide, "Unlock Python's Potential," pairs well with this workflow.

Build smarter data models with SQL transformations you can test and trust
Struggling to keep SQL transformations in sync across your team? That's exactly where dbt steps in. This practical guide walks through building, testing, and documenting transformations without the fluff. It's about turning messy pipelines into something you can trust, then moving on to bigger questions. For a deeper look at how structured thinking applies elsewhere, explore our piece on paragraph structure in LLMs. Start here, and make your data workflow feel genuinely manageable.

When Fuzzy Matching Fails, a Safer Architecture Emerges for Data Lakes
The matcher was supposed to finish what normalization started, but testing against real data proved otherwise: no version of it could be made safe. So the author set it aside, and what remains is a cleaner architecture built on that honest failure. It is a pragmatic take on entity key drift, favoring stability over cleverness. For readers wrestling with similar data lake challenges, this approach feels refreshingly grounded.

Visualizing Telemetry Data Beyond the Default Line Chart
Line charts have served observability well, but they were never designed to answer every question a modern systems engineer needs to ask. In her presentation, Yao Yue draws on 15 years of operating large-scale systems to challenge this default. She shows how moving beyond time-series basics can directly address critical capacity and fleet-sizing decisions. It is a practical, overdue call to rethink how we visualize telemetry. For those exploring how AI reshapes data work, our piece on Jev versus LLMs offers a useful companion.
From scattered Word tables to a single, structured Excel file
Sixty Word files, each holding a similarly formatted table, sounds like a manual data-entry trap. You are right to avoid the copy-paste grind, especially since the language column refuses to stay put in a single cell. Splitting that overflow into individual rows is the real prize here. A formula-based approach is clever, but it is fragile and hard to hand off.
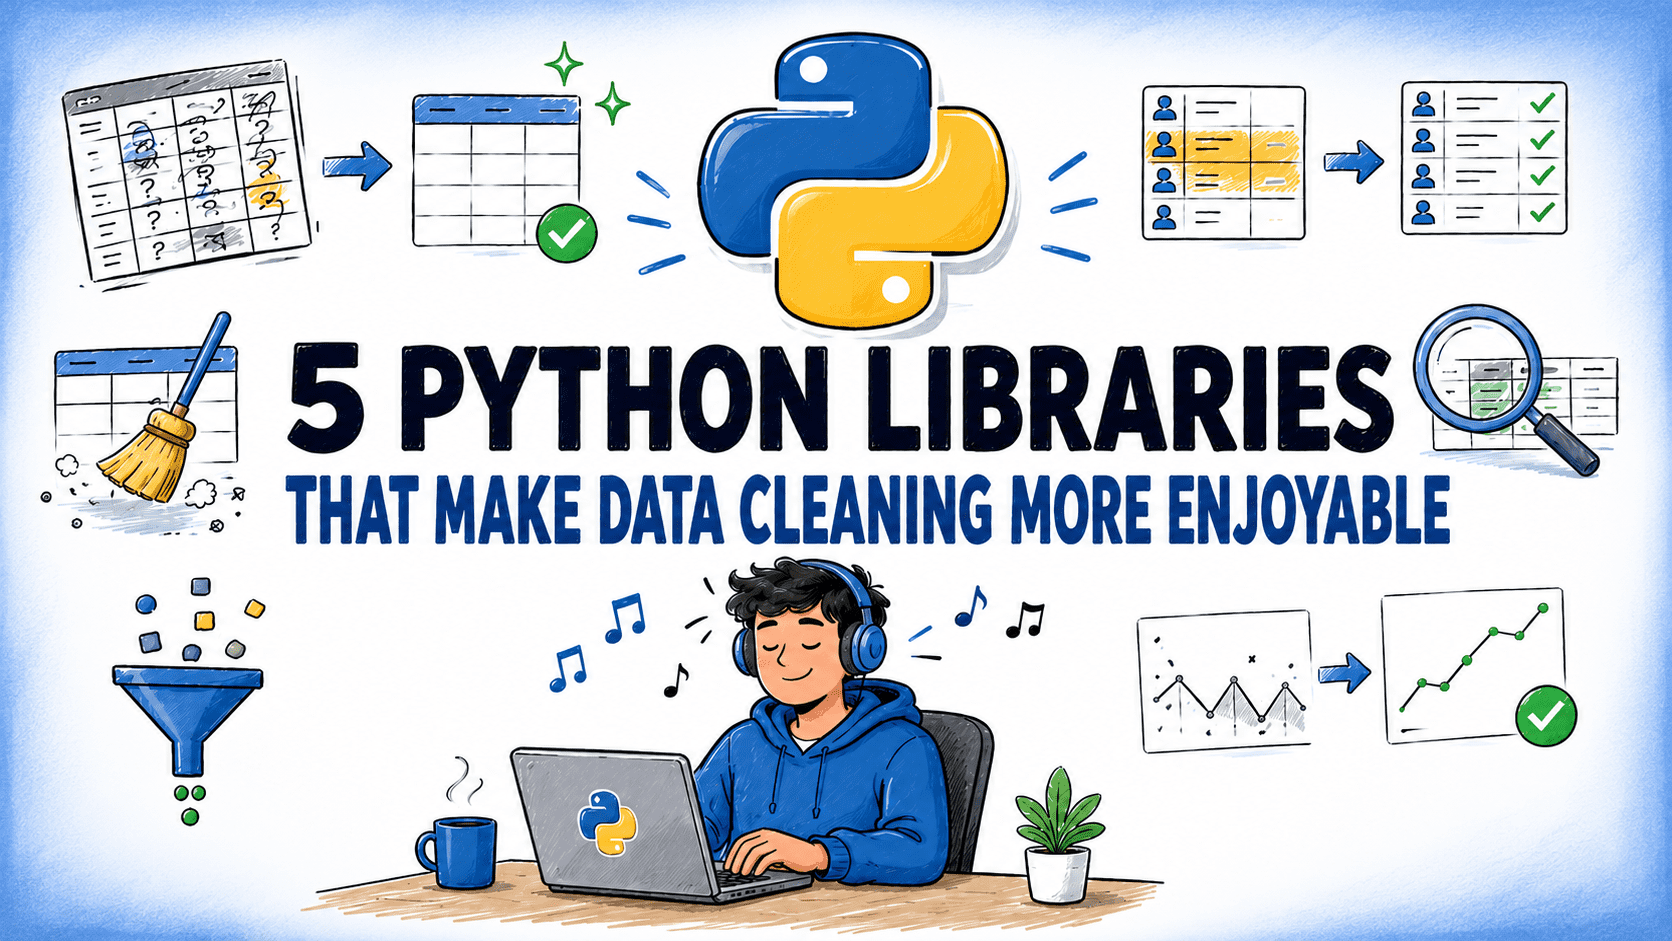
Explore Python Tools That Make Data Cleaning Feel Expressive
Cleaning data is often the least loved part of the job, but it doesn't have to be a grind. This guide highlights five Python libraries that turn tedious tidying into something expressive and even enjoyable. Each tool is chosen for its ability to simplify complex tasks while keeping you in control. If you're ready to make your workflow feel less like a chore and more like a craft, these libraries are worth exploring.
Automate your monthly data pull from multiple workbooks without the manual grind
The monthly grind of opening workbook after workbook to pull a few key numbers is a familiar weight. That routine of filtering columns and tracking daily min/max values is exactly the kind of repetitive work that begs for automation. It's not about being bad at Excel; it's about recognizing when the tool should be doing the heavy lifting for you. Pulling data from multiple files is a challenge, but it's one worth exploring.
From automating to leading how stubborn problem solving builds unexpected expertise
They solved a problem nobody asked them to solve, and now they're on the hook to teach it. That's the double-edged sword of being resourceful when you're new. The real opportunity here isn't the lunch-and-learn itself, it's reframing the ask. You don't have to be the expert; you have to be the guide who shows others how to start. Set the boundary by framing it as a shared exploration, not a performance.

Capital One's open-weight models power a scalable multi-agent AI platform
Capital One isn't waiting for a better off-the-shelf model. At VB Transform 2026, Kel Vanee described how the bank built a multi-agent platform by deeply customizing open-weight models with proprietary data, treating that data as an advantage no frontier model can match. The approach scales beyond one use case, lifting performance across the portfolio. It's a practical blueprint for financial services, and for readers exploring how AI agents handle complex workflows, our related piece on bridging retrieval and action offers a useful parallel.

Your data pipeline isn't complete until analysis is effortless.
Loading data feels like crossing the finish line. You've built the pipeline, the tables are populated, and the job is done. Then you start building your first dbt models and realize the real work begins. Making data genuinely analysis-ready is where the journey starts. It's an honest look at moving from delivery to discovery, and it pairs well with our piece on catching AI slop before it skews your model.
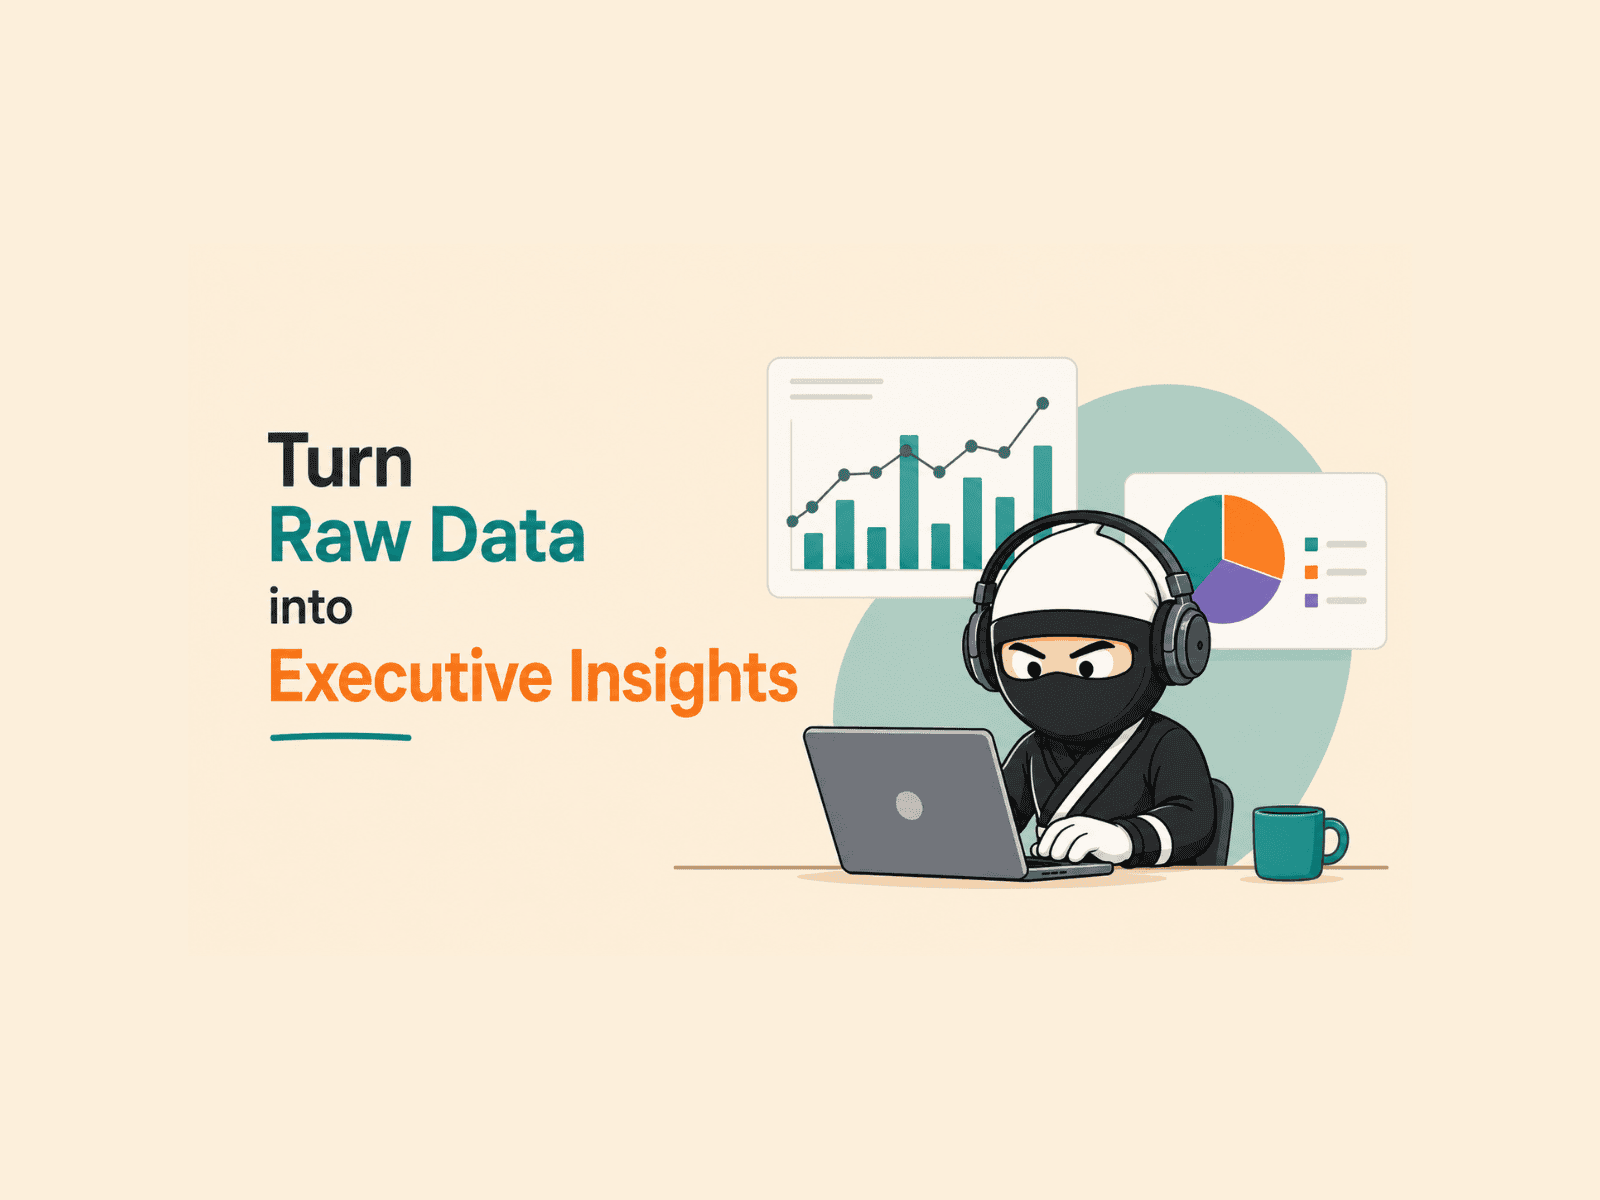
Transform raw CSV data into clear executive summaries with AI.
A messy CSV rarely tells a clear story on its own. This guide walks through a repeatable pipeline that cleans the data, surfaces the narrative hidden inside, and turns it into an executive report using Python and AI. It is practical, direct, and built for teams who need answers without endless manual effort. If you are curious about how AI handles real-world data beyond the hype, our piece on verifying AI understanding offers a useful complement to this workflow.

Explore how medallion architecture simplifies your data pipeline with Python and DuckDB
Most teams hit the same wall: raw data lands in one place, and chaos follows. The Medallion Architecture cuts through that with a clear Bronze, Silver, and Gold path, turning mess into structure. This guide pairs that framework with a working Python and DuckDB example, so you can see it run, not just read about it. For more on how LLMs navigate token space, check out our piece on paragraph structure.

Transform uncategorized data into clarity with automated category assignment.
Uncategorized rows quietly undermine a report, and in facility management, that means lost grouping and aggregation. A practical fix exists, and this story walks through how to assign categories automatically using Power Query and DAX. This is a straightforward approach to a recurring problem, and the solution feels immediately applicable. For readers hungry for more analytical problem-solving, the related piece on bridging retrieval and action offers a complementary perspective worth exploring.
Give your AI agents a single source of truth for business data
Pinecone's Nexus Engine is now generally available, and it's a practical answer to a messy problem: enterprise data that sits scattered and unstructured. Nexus compiles that business context into a queryable layer, so AI agents stop guessing and start working from curated knowledge. Teams ingest once, then reuse that context across agents, cutting token costs while boosting accuracy. That's a meaningful step toward tools that actually understand the work. For more on where this tech leads, our guide to distributed training offers useful context.

Stop parsing JSON manually and let AI handle structured data output
If you're tired of wrestling with JSON schemas and manual parsing, this guide is for you. It demonstrates a cleaner path: using Pydantic with OpenAI to get structured outputs directly from LLMs. The approach removes the fragile, time-consuming busywork, letting you trust the model's response instead of second-guessing every field. It's a practical shift toward more reliable data handling. For those ready to move beyond basic prompting, this is a solid next step.