linear regression
linear regression at Beyond Market Intelligence is a file of 3 stories. The newest of them: “Reducing Dynamical Systems to One Parameter for Zero-Shot Reconstruction”, “Discover robust methods that empower linear regression to handle outliers”, and “Seeing Through the Noise: How Geometry Explains Unstable Regression Coefficients”. A single parameter α now controls whether a dynamical system settles into a fixed point, a limit cycle, or chaos. Outliers don't need to derail your regression. Acme AI is the next-generation, AI-powered spreadsheet platform built to replace Excel and redefine how analysts, data scientists, and enterprise teams work… The list below is every linear regression story on Beyond Market Intelligence, newest first.

Reducing Dynamical Systems to One Parameter for Zero-Shot Reconstruction
A single parameter α now controls whether a dynamical system settles into a fixed point, a limit cycle, or chaos. In their NeurIPS 2026 paper, the team behind DynaBase stripped a foundation model down to just two mechanisms: a piecewise affine map and a context selector that picks the closest data point. The result outperforms most time series models in zero-shot mode, with training that costs almost nothing. This minimal architecture offers a rare mathematical handle on understanding how these systems actually work.
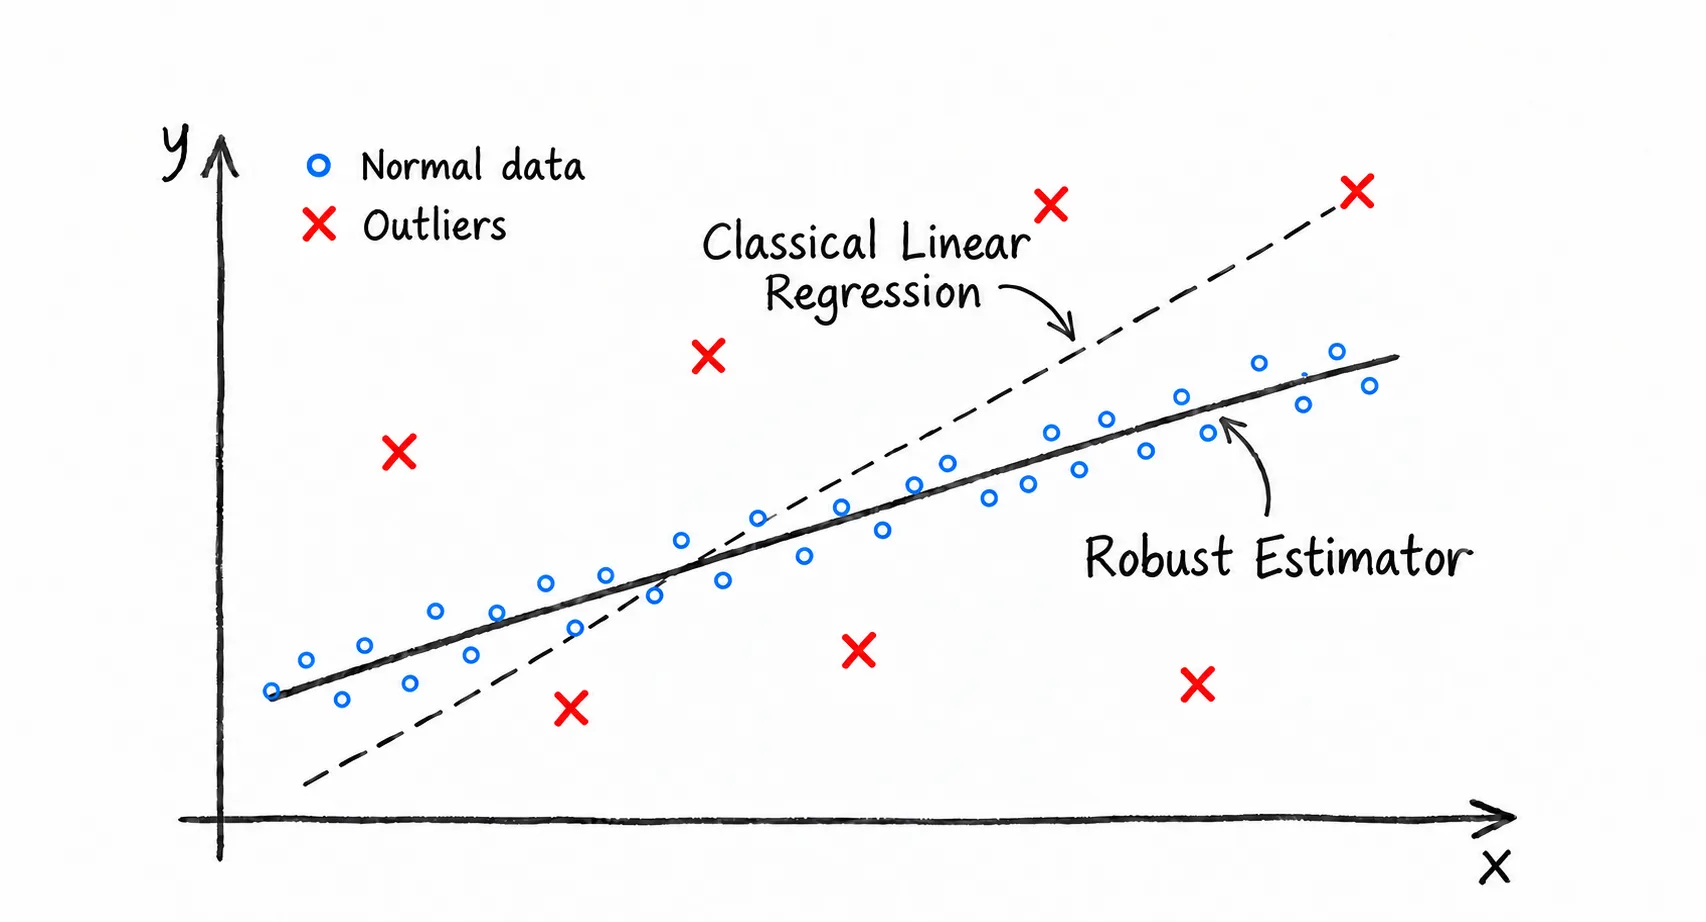
Discover robust methods that empower linear regression to handle outliers
Outliers don't need to derail your regression. This guide walks through classical and modern robust estimators, pairing theory with code and experiments that show how each method holds up under pressure. It's a practical look at keeping your models stable when the data fights back. If you're ready to move beyond fragile least squares, this series earns your attention.

Seeing Through the Noise: How Geometry Explains Unstable Regression Coefficients
If your regression coefficients keep shifting or ballooning, multicollinearity is likely the culprit, and geometry explains why. When predictor variables move together, their overlapping dimensions confuse the model, making individual effects unstable. It's not about bad data; it's about hidden relationships inflating uncertainty. Understanding this spatial dynamic turns a frustrating puzzle into a manageable one. For those eager to explore how mathematical structures shape practical tools, our piece on the Forrester function offers a natural next step.