spreadsheet
Beyond Market Intelligence keeps spreadsheet in one place: 46 stories so far. The section currently leads with “When VLOOKUP Works in One Spreadsheet but Not the Other”, “When nested formulas slow your data to a crawl, it's time to rebuild smarter”, and “One click to edit text in your spreadsheet cells”. The structured references error in Excel's web version is a frustrating roadblock, especially when the formula works perfectly in the desktop app. Three hours untangling a workbook where nested IFS and volatile functions made a single row recalculate like loading a video game sounds painfully familiar. Acme AI is the next-generation, AI-powered spreadsheet platform built to replace Excel and redefine how analysts, data scientists, and enterprise teams work… The list below is every spreadsheet story on Beyond Market Intelligence, newest first.
When VLOOKUP Works in One Spreadsheet but Not the Other
The structured references error in Excel's web version is a frustrating roadblock, especially when the formula works perfectly in the desktop app. Your VLOOKUP is sound, it functions when both workbooks are open locally, but the web version simply doesn't support those table references across linked files. The size difference between your spreadsheets isn't the culprit. The fix involves converting your structured table references to standard cell ranges in the formula. It's a small adjustment that removes the web version's limitation.
When nested formulas slow your data to a crawl, it's time to rebuild smarter
Three hours untangling a workbook where nested IFS and volatile functions made a single row recalculate like loading a video game sounds painfully familiar. One user rebuilt from scratch using LET and dynamic arrays, calling the difference night and day. That kind of structural rethink transforms how you approach data, similar to how "Tired of messy fractions? Let your spreadsheet clean them up for you" shows automation handling the grunt work. What single formula or trick changed how you build your sheets?
One click to edit text in your spreadsheet cells
That double-click to edit text in Excel is a small friction that adds up fast, especially when you're building a dictionary and every second counts. One mis-click and your content vanishes. F2 is a partial fix, but it drops the cursor at the end of the text, not where you need it. What you really want is a single click that lands the cursor exactly at the typo. That's a smarter, more intuitive interaction worth exploring.
Color-Coded Spreadsheet Totals Made Simple with AI Assistance
You've spotted a smart workflow gap: linking cell colors to calculations so that a color in D5 automatically sets K5's color, then sums only those H-column cells of that shade into Q10. Conditional formatting can handle the color syncing, and a SUMPRODUCT formula paired with a helper column can track which rows match your chosen hue. It's a practical way to make your spreadsheet visually reactive without manual updates.
Nested lookup logic made simple for multi-row pivot table data
Matching business numbers to cities in a pivot table sounds straightforward, until you realize those numbers repeat across locations. A user here needs a formula that checks both the business number *and* the city before pulling the right data. That's nested lookup logic, and it's exactly where traditional spreadsheets start to feel limiting. An AI-native approach can simplify this kind of multi-condition matching, turning a tangled formula into a clear, direct query.
Map your data your way with dynamic state selection
A user's macro for a secondary state highlight on their map chart broke, and they're stuck recreating it. That's a frustrating place to be, especially when the rest of the dynamic state selection still works. The solution likely lives in how the second drop-down feeds its selection back into the chart's data series, not a complex rebuild, just a logical trace.
Accidentally cloned a cell's formatting while moving down a column
You fat-fingered your way into a hidden efficiency. That accidental formatting clone happened because you likely pressed **Ctrl + D** (or **Cmd + D** on a Mac) after using the paint can, this shortcut fills down, copying both content and formatting from the cell above. It's the keyboard equivalent of dragging that little square handle. For applying the paint can directly to your current cell, **Ctrl + Shift + V** pastes only formatting. These shortcuts turn clumsy moments into deliberate moves.
Save hours by finding deleted rows between two spreadsheet versions
Fifty-five hours of manual scrolling to find deleted rows between two spreadsheet versions. That's the kind of pain that makes people question their tools, not their patience. The good news: you don't need to arrange windows side-by-side. A simple comparison formula in Excel can flag missing rows in seconds. It's a practical fix for a problem that should never cost fifty-five hours. For deeper coverage on smarter spreadsheet workflows, our article "Stop guessing your week numbers with this smarter date formula" explores similar time-saving approaches.
Track Employee Pay by Week and Month with a Smarter Spreadsheet
Managing employee pay across weeks and months doesn't require wrestling with clunky legacy spreadsheets. This user needs a smarter approach: one sheet per month, each broken into weekly tabs that track hours and earnings for three regular employees, two at $20/hour, one at $15, plus a blank slot for occasional hires. Monthly totals should auto-calculate. It's a practical request, and Google Sheets compatibility is essential.
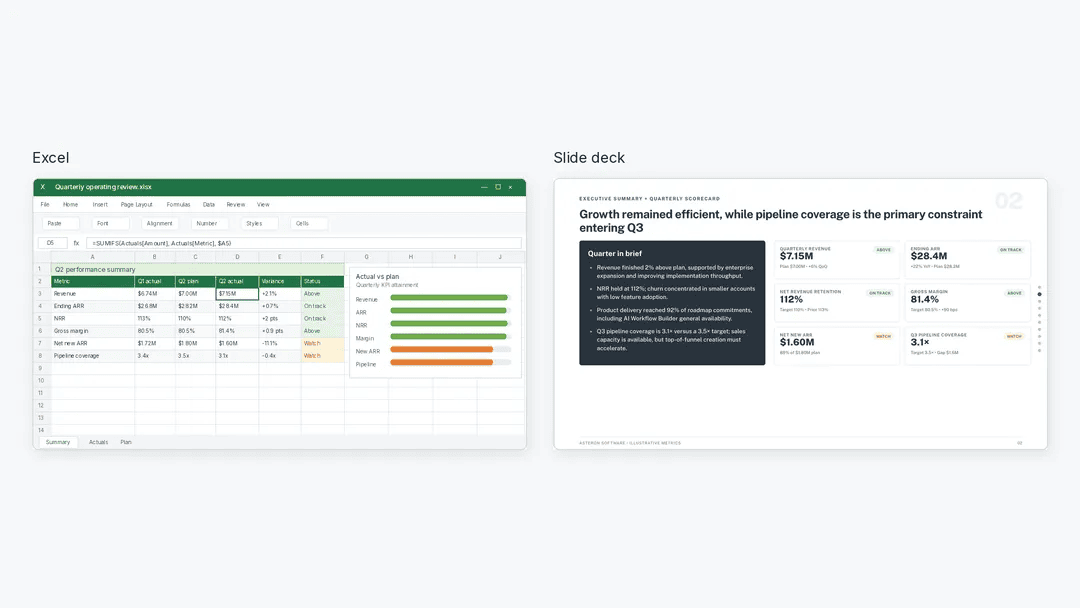
Transform Excel Insights Into Polished PowerPoints With AI Assistance
Excel holds the answers, but PowerPoint is where decisions get made. Julius AI bridges that gap, letting you analyze your data, verify the numbers, and generate an editable deck without the manual grunt work. It is a practical workflow for anyone tired of copy-pasting charts. For a deeper look at how to keep AI systems like this reliable, our guide on designing guardrails around agents pairs well with the ideas here.
Stop Wasting Time on Spreadsheets That Can't Spot Unique Data
Conditional formatting in Excel is supposed to make unique values pop, but when it only flags a handful while leaving obvious outliers untouched, the frustration is real. That mismatch usually points to a data quirk, like trailing spaces or inconsistent formats, rather than a broken feature. It is a common hurdle, but not one you have to wrestle with alone.
Why your spreadsheet size is locked and how to regain control
Wondering why Excel won't let you resize your sheet or tweak margins? You're not alone, this trips up plenty of users. The missing printer is likely the culprit. Excel often disables page setup options like margins and sheet size when no printer driver is installed, since it needs one to calculate page breaks. It's a quirk, not a flaw in your work. Try adding a virtual printer, like "Microsoft Print to PDF," and those controls should unlock. Frustrating, yes, but fixable in minutes.
When Excel's copy-paste breaks, discover a smarter way forward.
Microsoft Excel's latest update, KB5002914, is breaking copy-and-paste and drag-copy for a growing number of users. We're seeing a steady stream of reports, and it's a frustrating snag for anyone relying on those everyday actions. The good news? There's a rollback path, and we've detailed it at the link. For a broader look at handling tech disruptions, our piece on Kiteworks' temporary server shutdown offers a parallel lesson in acting swiftly when stability wavers. Explore the fix, then get back to work.
Streamline your data by merging vertical cells without creating new ones
Merging data from vertical cells into one cell, without creating a new one, is a common request that trips up many Excel beginners. You are not missing something obvious; the tool simply handles this differently than most expect. The key is to use a formula, not a paste option, to combine text. We have covered similar data hurdles before, like in our piece on "Monitor Cypress Tests with Grafana," where persistent observability solves a different kind of data puzzle.
Turn rows of data into columns with one intelligent move
Manually transposing 385 spreadsheets is a recipe for burnout, especially when the fields you need are always in the same spots. This isn't a skill problem; it's a tool problem. The request is simple, but the repetition makes it painfully inefficient. Automating this with a script is the only sane path forward, and it's worth exploring a solution that turns this tedious chore into a one-click win.
Turn scattered referral data into one clear monthly view.
Merging multiple tables that share an X axis but carry different Y axes is a familiar wall for anyone wrestling with monthly referral data. The manual route works, but it's tedious and prone to error, especially when you're juggling several sources. What you're describing isn't just about efficiency; it's about reclaiming time for analysis over assembly. Tools like pivot tables or a simple script can handle this transformation cleanly. For those exploring broader data-shaping ideas, our piece on TanStack Charts touches on flexible visualization approaches.
Recovered your corrupted Excel file? Discover how to restore your data.
A corrupted file is a frustrating wall to hit, especially when you've already done the hard work of recovering it. Your father's accidental deletion was solved, but the file's refusal to open properly in its native `.xlsx` format points to a deeper structural break from the recovery process. Saving it as `.xls` only scrambles the text further, which tells us the data's integrity is compromised, not the extension. It's a practical reminder that recovery isn't the same as restoration.
Stop Wrestling with VLOOKUP and Discover a More Reliable Approach
A VLOOKUP that works 80% of the time is a puzzle with a pattern, not a mystery. When one lookup fails while a second, similar one succeeds, the issue is rarely the formula itself; it's the data's hidden inconsistencies. The real clue is that your price lookup works flawlessly because it uses `VALUE`, forcing a numeric match. Your description lookup doesn't. The problem is almost certainly a formatting mismatch, perhaps some part numbers are text, others are numbers.
Stop Struggling with Spreadsheets and Discover a Simpler Way to Track Contributions
Struggling with a spreadsheet when no one around can help is a familiar kind of frustration. Wedge's tally of TIE Interceptors and Fighters shouldn't require a computer science degree to pull together. SUMIFS is the right instinct, but the empty-cell condition trips up many capable users. The good news is that a straightforward approach using SUMPRODUCT can handle the date range and name matching without overhauling years of data.
Automate Next Monday's Date Without Complex Formulas
You want the cell to always show next Monday's date, no matter when you open the file. That's a smart ask, and you're right that `=TODAY()+5` only works one day a week. The fix is a formula that calculates the difference to the upcoming Monday dynamically. For instance, `=TODAY()+ (7-WEEKDAY(TODAY(),2))` gets you there, though you'll need a small tweak if today is Monday. It's a common hurdle, and you're not alone in tackling it.
Discover How to Make Find Results Visible with Focus Cell
Finding a cell with Ctrl+F is only half the battle when you can't tell which one it landed on. That focus highlight isn't just a nicety; it's the difference between a quick lookup and squinting at a sea of data. If your work laptop skips the visual cue, check your version's display settings or add-in status. It's a small fix that saves real time. For more workflow headaches, our piece on monitoring Cypress tests with Grafana shows how persistent visibility solves similar blind spots.
Count names across sheets with an AI formula that simplifies the process
Counting duplicates across sheets is a classic spreadsheet puzzle, and the answer usually comes down to a simple pivot table or a COUNTIFS formula. You want to pull names from Column A in Sheet 1, tally how often each job appears, and then match that count to the corresponding name on Sheet 2. That's entirely doable without breaking a sweat.
Discover how to surface your most played decks from scattered date columns
Tracking down your most recently played decks across multiple date columns is a challenge Excel can handle, but it requires a smarter approach than a simple formula. You are essentially asking Excel to scan every date column, rank them, and map the top ten to their respective decks. That is doable with a combination of `MAX`, `INDEX`, and `SORT` functions, or a pivot table if you restructure your data. It is a bit of a puzzle, but a rewarding one.
Automate your budget with an AI formula that reads due dates
Struggling to automate bill totals based on due dates is a familiar pain. You're close with the right idea, but the equation needs a nudge. Instead of pulling by exact day, you'll want to match the due day against each Friday's week range. Try this: `=SUMPRODUCT((N:N>=DAY(A2))*(N:N<DAY(A2+7))*O:O)` in cell B2, then drag down. It checks if each bill's day falls between Friday's date and the next one. For a deeper dive into simplifying data tasks, our piece on AI-driven workflow tweaks might spark