formula generator
formula generator at Beyond Market Intelligence is a file of 108 stories. The newest of them: “From XLOOKUP to AI: The spreadsheet workflow is evolving faster than you think”, “When your IFS formula returns true but not the right result, it's time to explore the logic.”, and “Beyond 52 weeks: discover how AI can extend your project planning”. Welcome to this week's /r/Excel recap for May 16-22, 2026, where we dive into the top discussions and insights from the community. Acme AI is the next-generation, AI-powered spreadsheet platform built to replace Excel and redefine how analysts, data scientists, and enterprise teams work… The list below is every formula generator story on Beyond Market Intelligence, newest first.
From XLOOKUP to AI: The spreadsheet workflow is evolving faster than you think
Welcome to this week's /r/Excel recap for May 16-22, 2026, where we dive into the top discussions and insights from the community. This week, users celebrated the transformative power of XLOOKUP, shared quick tips for Excel tasks, and sought solutions for complex challenges. Notable posts include a showcase of a QR code generator in Excel and inquiries about workbook protection. For those looking to enhance their skills, check out our related article on "SUMIF Working but SUMIFS not working.
When your IFS formula returns true but not the right result, it's time to explore the logic.
Are you experiencing issues with your IFS function, where it's returning "Input Needed" for certain drop-down selections despite recognizing them as true? In your case, it seems to work for most options but fails for "General fiction," "Crime," and "Comics," even though they appear formatted the same as others. This could stem from subtle discrepancies in data formatting or the values being referenced.
Beyond 52 weeks: discover how AI can extend your project planning
Creating a Gantt chart in Excel can be a straightforward process, but the default template is limited to a 52-week timeline, which can be frustrating when managing long-term projects. If you've already invested time entering your project details and want to extend your chart to cover multiple years, there’s a way to modify the formulas for a more adaptable timeline. In this guide, we’ll explore how to adjust your Excel Gantt chart effectively while ensuring your project planning remains seamless.
When Your COUNTA Formula Shows Blank Instead of the Right Answer
If your COUNTA formula is returning a blank cell despite appearing correct in the formula builder, it can be frustrating. In your case, the formula `=COUNTA('Player 1:Player 2'!C12)` should count all nonblank cells across the specified sheets, yet it shows no result. Check for hidden characters or formatting issues in the referenced cells. If the issue persists, consider reviewing our article "How to combine two sheets into one" for additional insights that might help you troubleshoot this problem effectively.

Measuring AI through a human lens: IQ scores for language models arrive.
Introducing AI IQ, a groundbreaking platform that assigns estimated IQ scores to over 50 leading AI language models, using the familiar yardstick of human intelligence. This innovative approach offers interactive visualizations at aiiq.org, making the complexity of AI advancements more accessible. While praised for its clarity by technologists, it also faces criticism for oversimplifying AI capabilities into a single number. For a deeper dive into the future of AI and its evolving landscape, explore our related article on Anthropic’s vision for proactive AI.

How Interface Transparency Builds Trust in Agentic AI
In "Practical Interface Patterns For AI Transparency (Part 2)," we delve into why traditional loading patterns, such as spinners, can fall short in agentic AI experiences. By adopting interface patterns that transparently reveal the system's processes, status, and decision-making, we can significantly enhance user trust and engagement. This invites you to explore innovative approaches that prioritize transparency, ultimately empowering users in their interactions. For a deeper understanding of AI evaluation, check out our article, "Building an Evaluation Harness for Production AI Agents."
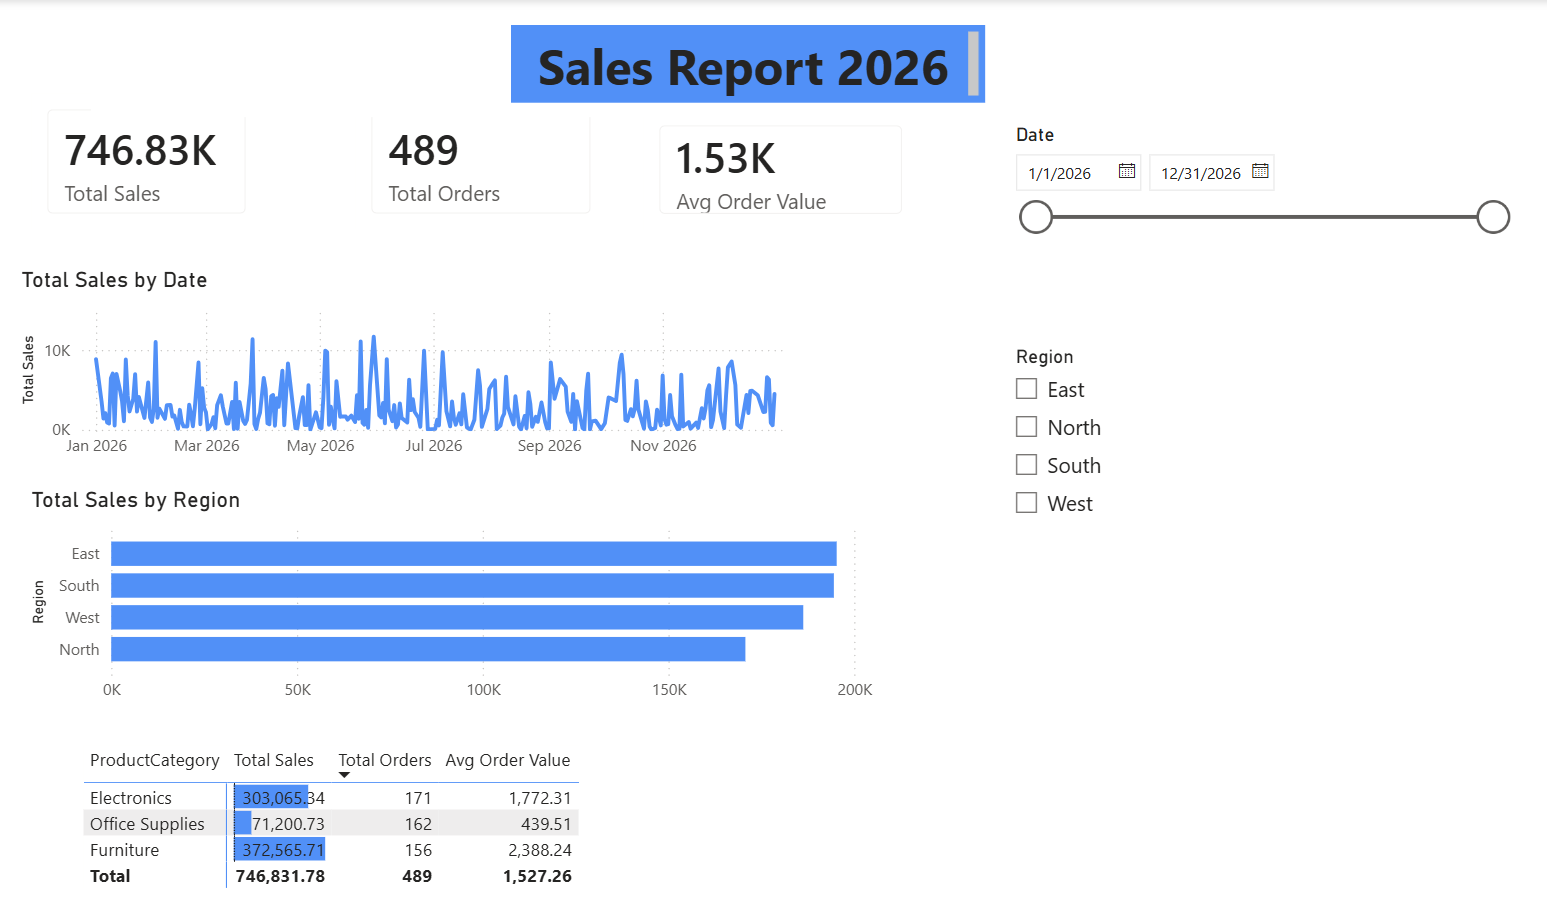
From raw data to interactive dashboard: build your first Power BI report
Welcome to our Power BI tutorial, where you’ll transform a raw data file into a polished, published report. This guide will walk you through the entire process, from initial data queries to deploying your finished dashboard in the cloud. You’ll learn to create an interactive dashboard that not only visualizes your data effectively but also includes essential features like alerts and automatic refresh settings. By the end, you’ll have the skills to empower your data storytelling and enhance your decision-making. Let's dive in and explore!
Simplify Complex IF/OR Logic with a Clearer Approach to Eligibility
In your quest to create an effective IF/OR formula, it's essential to ensure that each condition is evaluated correctly. Your initial formula attempts to output "YES" for eligibility, but it only returns "NO" if any of the criteria are met. This behavior suggests that the formula might not be triggering as expected due to the interaction with the conditional formatting or data entry practices. To resolve this, review the conditions carefully and test with varying data inputs.

Your smartphone has an app store. Now your robot does too.
Hugging Face has launched the Reachy Mini App Store, revolutionizing robotics by making it accessible to everyone. This innovative platform offers over 200 community-built applications for the Reachy Mini, a low-cost open-source robot priced at just $299. By removing the barriers typically associated with robotics, users can now create functional software using plain language, regardless of technical expertise. This democratization of robotics empowers individuals to explore new possibilities and redefine how we interact with machines, making advanced technology approachable and engaging for all.
Describe your data and let AI handle the formulas.
Introducing Neural Sheet, a web app designed to simplify your Excel workflow. If you often find yourself bogged down by complex formulas and data structuring, this tool is here to help. Just upload your Excel file and describe your desired outcome in plain language, and Neural Sheet generates the result for you. You can easily download your refined data as a standard Excel file.
Name your cells, not your frustrations: smarter formulas start here
When considering whether to use named cells or referencing addresses in formulas, the debate often centers on usability versus performance. Named cells, or defined variables, can enhance clarity and maintainability, especially in complex workbooks. However, referencing addresses allows for greater flexibility when dragging formulas across rows and columns. As you rebuild your tool, think about the balance between these options. While named ranges may require more upfront effort in documentation and replacement, they could offer long-term advantages in stability and ease of understanding.
Master Date Subtraction in Spreadsheets Without the Guesswork
Transitioning to a more analytical role can feel overwhelming, especially when working with Excel. If you're looking to subtract 425 days from a date in one column using a formula, the formula you've used is on the right track. However, it's essential to ensure the dates are formatted correctly for accurate calculations. You may need to adjust your column format to "Date" to see the results. Let's explore how to set this up properly so you can confidently manage your data moving forward.
Map uneven parent-child data without macros using this accessible approach
Managing variable-dependent items in Excel can be a challenge, especially when each parent document type requires a different number of child items. This workaround utilizes a mapping table to automate the assignment process without macros, allowing users to bypass manual selection and maintain the integrity of their workflows. By employing a COUNTA pointer and INDEX formulas, the solution dynamically assigns the next valid child item based on the chosen parent. This method enhances productivity, prevents errors, and simplifies complex structures while ensuring user-friendliness.

xAI ships Grok 4.3 and a voice cloning suite at a competitive price
xAI has launched Grok 4.3, a new large language model that enhances performance while maintaining an aggressively low pricing structure. This release comes amid ongoing legal battles involving founder Elon Musk and OpenAI co-founder Sam Altman. Grok 4.3 introduces advanced reasoning capabilities and a powerful voice cloning suite, designed to optimize user workflows. With significant improvements in specialized tasks, Grok 4.3 positions itself as a strong contender in the AI landscape, offering both affordability and functionality for developers and enterprises alike.
Turn 52 weekly sheets into one clear annual summary with AI.
Consolidating multiple sheets into a Year-to-Date (YTD) summary report can streamline your data management and reporting process. With 52 uniquely named weekly sheets, creating a cohesive summary may seem daunting. However, by leveraging Excel’s advanced features, such as Power Query, you can automate data consolidation while maintaining your existing weekly report format. This guide will walk you through the steps to effectively combine your data, ensuring you meet your reporting needs without sacrificing the ease of your current setup.
Track Event Revenue with Smarter Checkbox Formulas
Tracking attendance and revenue for your event can be streamlined using checkboxes and specific formulas in your spreadsheet. To calculate the total gross amount received, your current formula, `=SUMIF($C$3:$C$7,TRUE,$B$3:$B$7)`, effectively sums confirmed payments. For the net amount, you need to account for service costs, which include a 6.95% fee and an additional £0.59 per entry. Adjust your formula to ensure the service cost is applied to each row individually, allowing for accurate net revenue calculations. Let's refine your approach
Stop blank cells from masquerading as zeros in conditional formatting
Conditional formatting in Excel can be a powerful tool for visualizing data, but it can also lead to confusion, especially with blank cells. In your case, it seems that the formatting rules are inadvertently applying to empty cells, causing them to appear green. To ensure that blank cells remain unformatted, you can adjust your conditional formatting rules. By adding a condition that explicitly checks for blank cells, you can maintain clarity in your working hours chart.
Explore smarter formula logic and cleaner data workflows from this week's top discussions
Welcome to this week’s recap of the /r/Excel community for April 18-24, 2026. Dive into the top discussions, where users tackled challenges ranging from combining AND and OR conditions in formulas to unresolved issues with Power Query and Excel's buffering. Explore insights from the most engaging comments, including tips on handling binary conversion quirks and formula troubleshooting. This week's highlights reflect a vibrant exchange of knowledge and support, empowering users to enhance their Excel skills and streamline their workflows. Join the conversation!
Generate precise hour sequences between dates with AI simplicity
If you're looking to generate a series of hourly intervals between a specified start and end date, focusing only on the hours from 9 AM to 9 PM, you can accomplish this with a tailored approach. Instead of generating all 24 hours, adjust your formula to capture just the desired range. By leveraging the power of spreadsheets, you can create a sequence that lists each hour for every date within your defined range, ensuring a clear and organized output that enhances your productivity.
Stop Hiding Duplicates in Your Reconciliations With Vertical Netting
If you're frustrated with Excel reconciliations that claim to be "MATCHED" while hiding duplicates and missing entries, it's time to explore a new approach. After a decade of experience in FP&A, I developed **Vertical Netting**, a framework designed to identify discrepancies that standard methods overlook. By reframing reconciliation as a summation problem rather than a simple comparison, this method ensures accuracy and clarity. Join me in discovering how to transform your reconciliation process and achieve true data integrity.
Spot new and updated records across database snapshots with ease.
In the quest to manage a large database of 7,500 records effectively, comparing snapshots over varying intervals can be challenging. This guide explores how to identify unique records and highlight specific record changes between two snapshots. By leveraging unique ID numbers, you can track records that have changed, entered, or left the database since the last snapshot. With the right approach, even without VBA, you can streamline this process, ensuring valuable insights are easily accessible for enhanced data management. Let's dive into the solution!
Discover how to expand table columns automatically based on a single input number.
If you're looking to enhance your spreadsheet by dynamically generating additional columns based on a specified number, this guide will help you achieve that without using macros. By inputting a number, X, in a designated cell, you can create the desired number of columns next to the original column, effectively copying any formulas present in the original. While exploring functions like SEQUENCE and Power Query may have proven challenging, we'll provide a straightforward approach to meet your requirements seamlessly. Let’s transform your data management experience!
Map Your Team's Event Reach With Interactive Hover Details
Creating a world map in Excel that displays hover text for event attendees is an exciting way to visualize participation across countries. With Excel 365 and Power Maps enabled, you can turn your data into an engaging visual tool. By organizing your table with columns for Employee Name, Event Name, Team Name, and Country, you can generate a map chart. The challenge lies in effectively displaying multiple entries in hover text, ensuring clarity for your colleagues.
Discover smarter Excel workflows with this week's top community insights.
Welcome to this week's /r/Excel recap for April 11 to April 17, 2026. Dive into the top five posts where users share valuable insights, including a pro tip on harnessing Power Query's capabilities and solutions for anonymizing user names in datasets. Uncover creative ways to populate cells based on specific criteria and explore discussions surrounding VLOOKUP formulas. Additionally, we highlight unresolved inquiries, such as double-decimal issues in Excel. Join the conversation and enhance your spreadsheet skills with these engaging community contributions.