statistical analysis
19 stories filed under statistical analysis on Beyond Market Intelligence. The newest of them: “From counterfactual analysis to an AI product that empowers your data work”, “From Loot to Logic: Build Your Own Probability Tracker”, and “See Through the Hype of Your AI Feature's Adoption Numbers”. Building a counterfactual engine is one thing. Building a statistical cheat sheet for loot probability is a smart way to turn frustration into clarity. Acme AI is the next-generation, AI-powered spreadsheet platform built to replace Excel and redefine how analysts, data scientists, and enterprise teams work… The list below is every statistical analysis story on Beyond Market Intelligence, newest first.
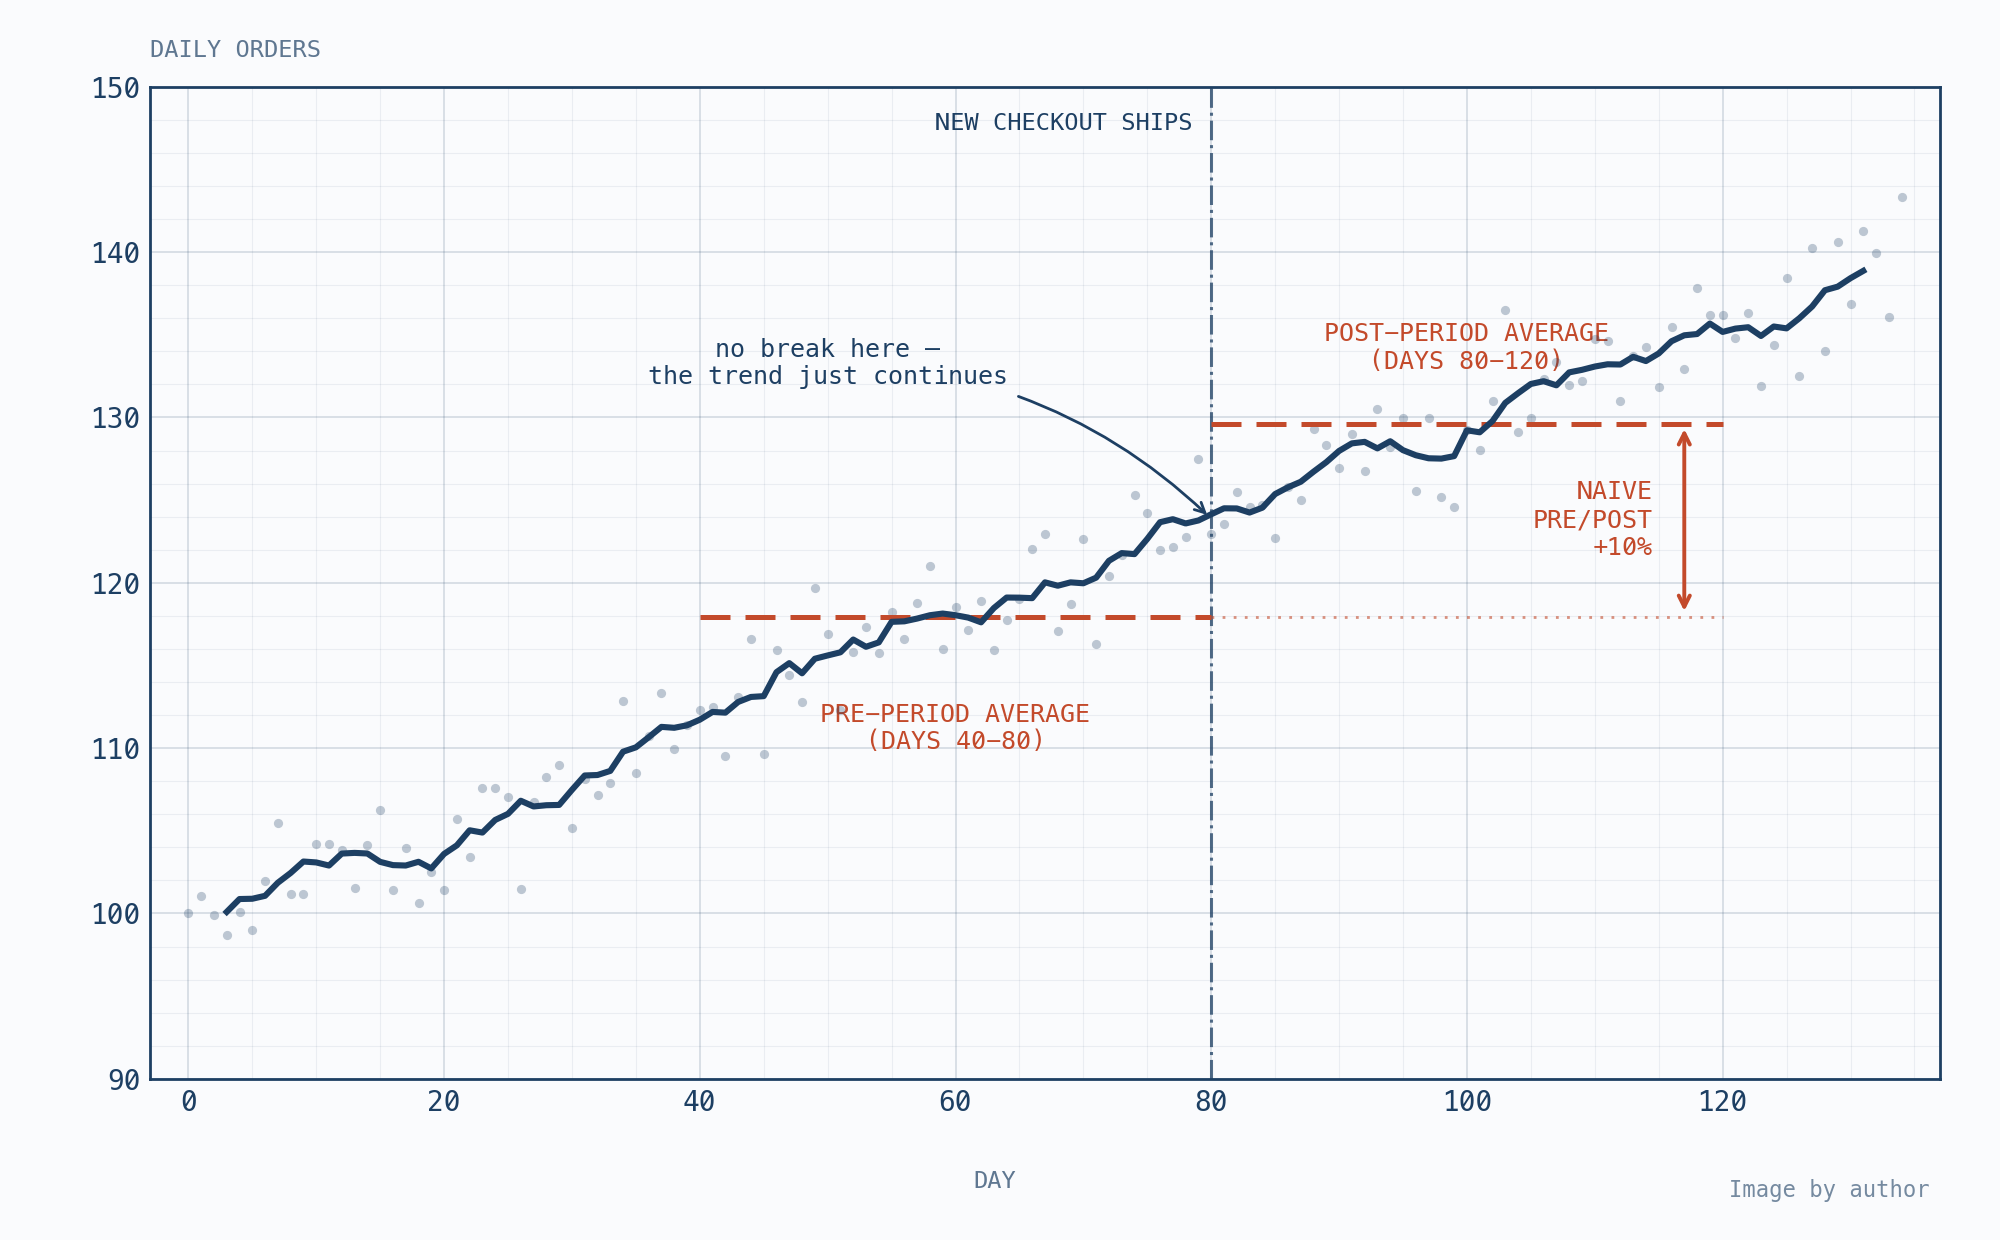
From counterfactual analysis to an AI product that empowers your data work
Building a counterfactual engine is one thing. Turning it into a multi-agent product is another. This walkthrough shows exactly what it takes to move interrupted time series analysis from a manual research task into an AI-driven workflow. It's a practical, honest look at the engineering and design choices that matter. If you're curious how structured reasoning gets automated, this is worth your time. For a deeper dive into the underlying mechanics, our guide to distributed algorithms pairs well with the concepts explored here.
From Loot to Logic: Build Your Own Probability Tracker
Building a statistical cheat sheet for loot probability is a smart way to turn frustration into clarity. The user's plan to map binomial distributions onto reroll costs is practical, and the percentile overview idea adds real insight. The main hurdle is linking cost scaling to roll counts, but that's solvable with a lookup table. For a deeper dive into adaptive systems that handle variable outcomes, check out "Evolve Your Recommendations: Real-World Insights on Adaptive Systems.
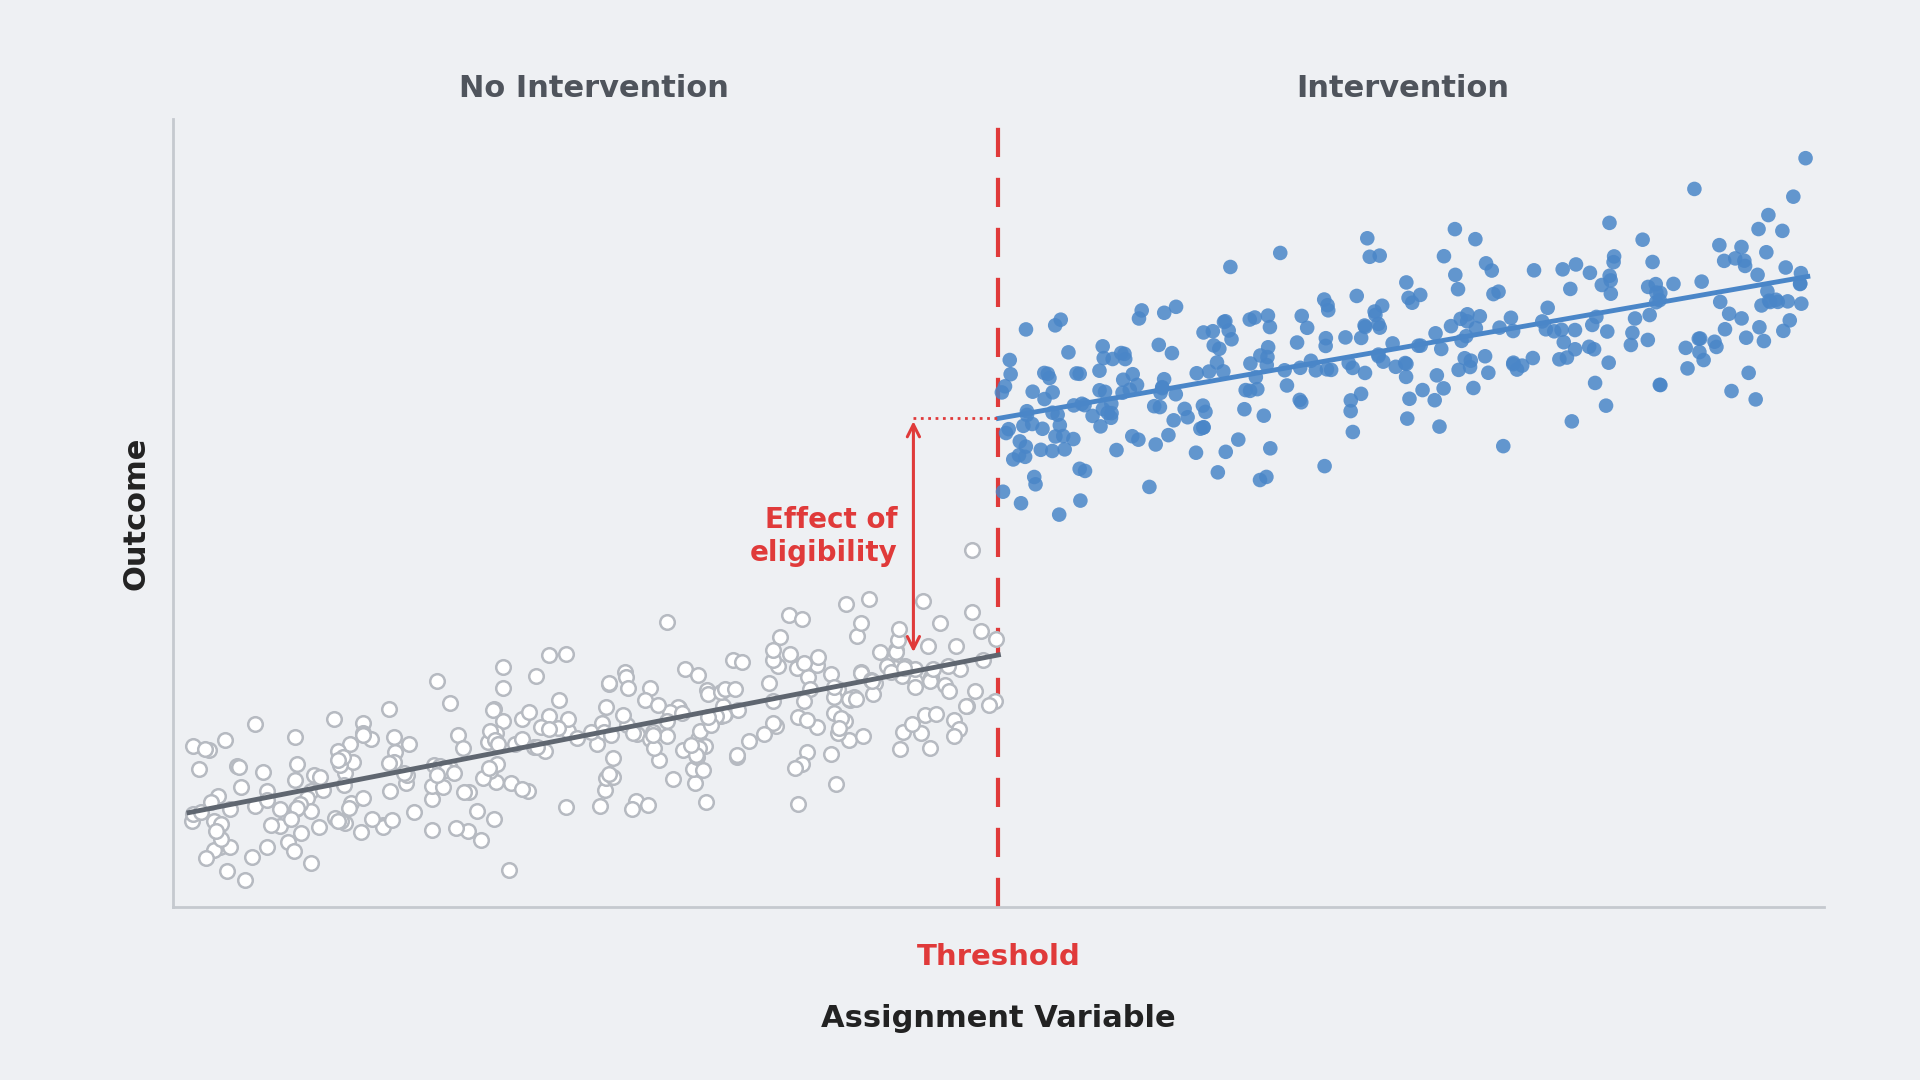
See Through the Hype of Your AI Feature's Adoption Numbers
When a team opts into an AI feature, the lift you measure isn't just the tool's effect. It's a selection effect, a reflection of who chose to engage. This guide offers a practical framework for estimating what that opt-in feature actually did, even without randomization. It's a sharp, honest look at a messy problem. For practitioners ready to dig deeper into the mechanics of modern AI systems, our guide to distributed algorithms pairs well with this mindset.
A positive signal or routine step: reading between the Neurips site selection email
A site selection email from NeurIPS can feel like a signal, but it's worth reading carefully before you start planning a celebration. This message is a procedural step, not a verdict on your paper's quality. It likely went out to every non-withdrawn submission as part of the logistics pipeline. That doesn't diminish the work you've done; it just means the real decision is still ahead.

Stop Misreading Your Data How Confidence Intervals Shape Decisions
Most of us assume that a 95% confidence interval means there's a 95% chance the true value lies within it. That's the illusion. This piece unpacks that confusion, clarifying how frequentist intervals and Bayesian credible intervals answer fundamentally different questions. It's a sharp, practical warning: misuse these tools, and you'll distort product decisions. For those eager to keep sharpening analytical instincts, the discussion pairs well with insights from our piece on adaptive systems, where similar precision matters in recommendation design.

Build an AI pipeline that verifies every number before it answers
A spreadsheet that confidently gives you a wrong number is just a rumor with a toolbar. That's why we built a six-stage pipeline for an AI data analyst that thinks like a senior analyst: it checks its numbers before calling anything an answer. It's a disciplined approach to verification, not hype. If you're tired of tools that guess, explore this. For a related primer on the underlying mechanics, our guide to distributed algorithms is a solid starting point.

What Hidden Gaps in Your Data Reveal About Your Assumptions
We often treat missing values as a glitch, a blank cell to be filled or dropped. But that silence carries its own message, hiding assumptions we rarely question. This piece on Towards Data Science digs into what we overlook when data goes unrecorded, challenging us to see absence as part of the story. It is a thoughtful, grounded read for anyone who has ever trusted a dataset too quickly.

The Equation That Reveals Bagging's Limits and Why Randomness Matters
Bagging has a ceiling, and no amount of trees will break it. The equation explains why random forests need that extra layer of chaos to keep improving. It's a sharp reminder that more isn't always better when the mechanism stalls. The experiment makes the point concrete, turning theory into something you can see. If distributed systems intrigue you, *Unlock LLM Training* pairs well with this mindset, though it stands firmly on its own.

Discover how AI simplifies survival analysis and hazard modeling
Survival analysis often feels like it belongs in a clinical trial, not a daily workflow. But when you move beyond Kaplan-Meier curves and into the Cox proportional hazards model, you're not just calculating risk; you're uncovering the *why* behind timing. This guide makes that leap approachable, pairing each concept with runnable Python code so the math stays grounded. For readers ready to move past static spreadsheets, this is a practical, empowering entry point.
What honest limitations reveal about trust in modern research
A researcher asking whether an honest limitations section hurts a paper is asking the wrong question. The real issue isn't bias; it's trust. Reviewers, whether human or AI, are more likely to respect a candid assessment than a polished facade. Hiding flaws invites skepticism, not approval. If anything, a thoughtful limitations section signals rigor. It shows you know what you don't know. That builds credibility. So no, it won't hurt. It might even save you from a reviewer who would have found the gaps anyway.

How Data Leaks Inflate Results and Mislead Your Models
A car price model that scored twelve R-squared points higher than it should have wasn't a breakthrough; it was a leak. A preprocessing pipeline let the model peek at the test set before the exam, and the inflated results masked a deeper problem. That kind of shortcut doesn't just distort one metric, it erodes trust in the entire evaluation. It's a sharp reminder that data hygiene is part of model integrity, not a side note.

How AI Transformed a Data Scientist's Daily Workflow
The morning no longer starts with a chaotic scramble through CSV files. By 2026, the data scientist's workflow has shifted from manual cleanup to strategic oversight, where AI handles the repetitive grind. It's a transformation that feels less like automation and more like partnership. We still ask the hard questions, but now we have a thinking partner that accelerates discovery.

Explore why early A/B test significance often misleads your decisions
A single day of statistical significance in an A/B test is not a win. It's a mirage. The post "Stop Calling the First Significant Day a Win" challenges that premature celebration, and it's a critique worth taking seriously. We often chase early signals, but data needs time to stabilize. The rush to declare victory is understandable, yet it undermines the entire process. For those looking to refine their analytical instincts, this pairs well with our piece on catching AI slop before it skews your model.
Theory paper scores after rebuttal reveal familiar patterns worth exploring
The rebuttal period has ended, and the score distribution for theory papers is now the question on everyone's mind. One researcher reports a 4 / 4 / 4 with moderate confidence, noting that theory work often trails behind and that this year's scores feel lower across the board. That observation matches the quiet tension many authors feel. We are watching where the empirical cutoff lands, and for deeper context on how structured reasoning shapes these evaluations, our guide on paragraph structure offers a useful parallel.

Spotting AI Text: Simple Cues and the Math Behind Them
You don't need a model to spot AI-generated text. Research-backed cues reveal LLM output, and the mathematical intuition behind *why* those signals hold up is also explained. That's the kind of practical clarity that empowers you to trust what you read. It's not about paranoia, it's about precision. For more on how AI shapes content creation, explore the related discussion on transforming open LLMs into classifiers.
Explore how NeurIPS 2026 score trends reveal a shift in AI research evaluation.
The post-rebuttal score distribution poll for NeurIPS 2026 taps into a genuine moment of uncertainty. With no Papercopilot data yet, the community is left guessing whether scores truly dipped or if perception is playing tricks. The poll is rough, self-selecting, and the trolls have already muddied the waters, but the impulse to measure is right. Data beats speculation, even imperfect data. For those exploring how AI reshapes research workflows, this kind of crowd-sourced snapshot offers a starting point, not a verdict.
When to choose simple analysis over machine learning
Not every data question deserves a model, and that is the right instinct to start with. In our experience, the decision to reach for machine learning hinges on whether the problem truly needs pattern recognition at scale or if a transparent analytical approach solves it faster. We often ask: can a simple formula explain this clearly to a stakeholder? If yes, skip the complexity.

Explore how margin of error shapes what polls actually tell us
Polls dominate how we talk about elections, yet their numbers often feel deceptively solid. A margin of error isn't a flaw or a hedge; it's a measure of honesty. Pew's explainer cuts through the noise, showing why that 3-point swing is less about bad polling and more about the limits of any sample. It's a useful reality check for anyone reading a crosstab like a fortune teller. For more on how data tools shape our understanding, explore the Forrester Function piece.

Seeing Through the Noise: How Geometry Explains Unstable Regression Coefficients
If your regression coefficients keep shifting or ballooning, multicollinearity is likely the culprit, and geometry explains why. When predictor variables move together, their overlapping dimensions confuse the model, making individual effects unstable. It's not about bad data; it's about hidden relationships inflating uncertainty. Understanding this spatial dynamic turns a frustrating puzzle into a manageable one. For those eager to explore how mathematical structures shape practical tools, our piece on the Forrester function offers a natural next step.