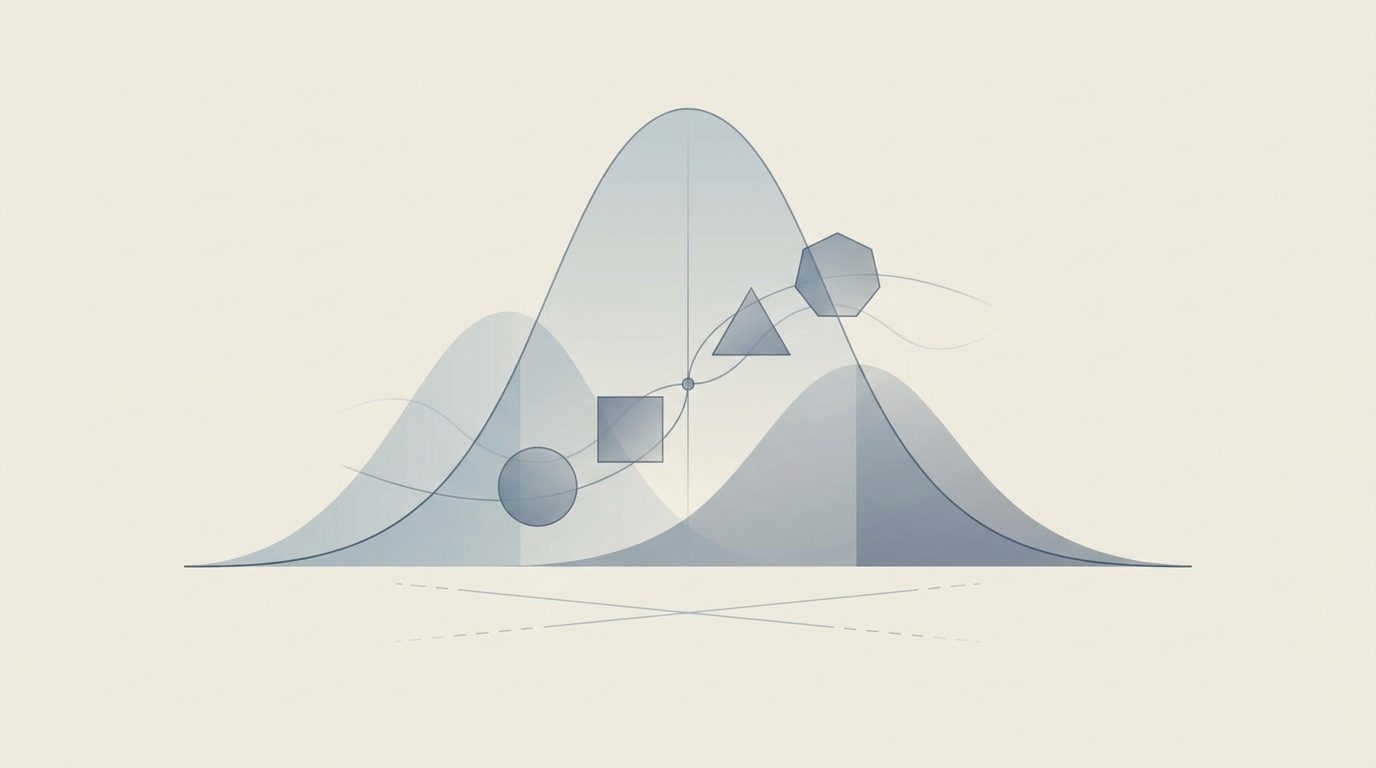
Most of us meet the mean early, and we rarely question what it leaves out. The mean tells us about the center, but it says nothing about the shape around it. That is where variance steps in, and then things get interesting. Statistical moments, the mean, the variance, and the higher powers of a distribution, form a kind of progressive portrait of your data. It is not a new idea, but it is one that most spreadsheet users never get to see in practice. We think that is a missed opportunity, because moments are the difference between knowing an average and understanding a dataset.
When you move past the second moment, you start to see the silhouette that this progression reveals. Skewness and kurtosis are not just terms for statisticians to throw around. They are the practical tools that tell you whether your data is lopsided, whether outliers are pulling things around, and whether the tails are fat or thin. For anyone working in a spreadsheet, this matters more than the average suggests. A mean without variance is a guess. A variance without skew is still incomplete. Each moment adds another layer to the story, framing the progression clearly. If you have ever looked at a column of numbers and felt that something was off, even though the average looked fine, this is the reason. The hidden silhouette is the shape your data actually takes, not the one implied by a simple average.
What we would tell a reader who asks about this is simple: do not wait until you need a full statistical model to care about moments. Start by looking at the variance of anything you measure regularly. Then ask if the distribution is symmetric. Then ask about the tails. That is it. You do not need a PhD to do this, and you do not need to abandon your spreadsheet. You just need to ask better questions of the numbers already sitting in front of you. This is a good entry point, and we would pair it with a broader look at how data literacy is changing in the age of AI. For a deeper dive, consider how descriptive statistics shape decision-making or why outliers demand more than a quick glance. And if you want to see where this thinking leads, the piece on data distributions and their real-world impact is worth your time.
The takeaway we want you to hold onto is this: the mean is not the story, it is just the first sentence. The moment you start looking at variance and beyond, you are no longer summarizing data, you are reading it. That shift matters because the tools we use are starting to catch up. AI-native spreadsheets will soon surface these moments for you automatically, but you have to know what you are looking at when they do. Watch for the third moment. That is where the shape of your data starts to tell the truth, and it is the difference between being surprised by your numbers and understanding them.