graph
graph at Beyond Market Intelligence is a file of 10 stories. The newest of them: “Unlock Advanced RAG: 6 Architectures for Semantic Search & LLMs”, “Beyond Prompts and Loops: How Graph Engineering Shapes Smarter AI”, and “Designing Data Infrastructure Without Looking at the Questions”. Basic graph retrieval only gets you so far. The debate over loops versus graphs in AI agent design isn't just technical sparring; it's a signal of how far we've come. Acme AI is the next-generation, AI-powered spreadsheet platform built to replace Excel and redefine how analysts, data scientists, and enterprise teams work… The list below is every graph story on Beyond Market Intelligence, newest first.

Unlock Advanced RAG: 6 Architectures for Semantic Search & LLMs
Basic graph retrieval only gets you so far. This guide walks through six production-oriented architectures that pair semantic search with knowledge graphs and LLM reasoning, giving practitioners a practical route beyond simple vector lookups. It's a grounded, no-nonsense read for teams ready to move past toy demos. For a deeper look at how LLMs handle structure internally, pair it with our piece on paragraph structure and token space. The ideas complement each other well.

Beyond Prompts and Loops: How Graph Engineering Shapes Smarter AI
The debate over loops versus graphs in AI agent design isn't just technical sparring; it's a signal of how far we've come. Graph engineering moves beyond the linear constraints of prompts and loops, offering a structured way to build workflows that adapt and scale. It's a practical evolution, not a buzzword. For those still wrestling with token-level nuances, our piece on paragraph structure offers a useful parallel. This shift matters because it redefines what we can build, and we're just beginning to explore its potential.
Designing Data Infrastructure Without Looking at the Questions
Building a memory graph from known structures like people, facts, and timestamps is not overfitting; it's schema-aware engineering. You built extractors blind to the QA pairs, yet recall stays high on fresh conversations. That's a strong signal your design matches the domain, not the test set. The cleanest test: run the same pipeline on a different format or topic, then compare. If it generalizes, you're done. For deeper context, our piece on AI agent swarms explores similar data-handling challenges.
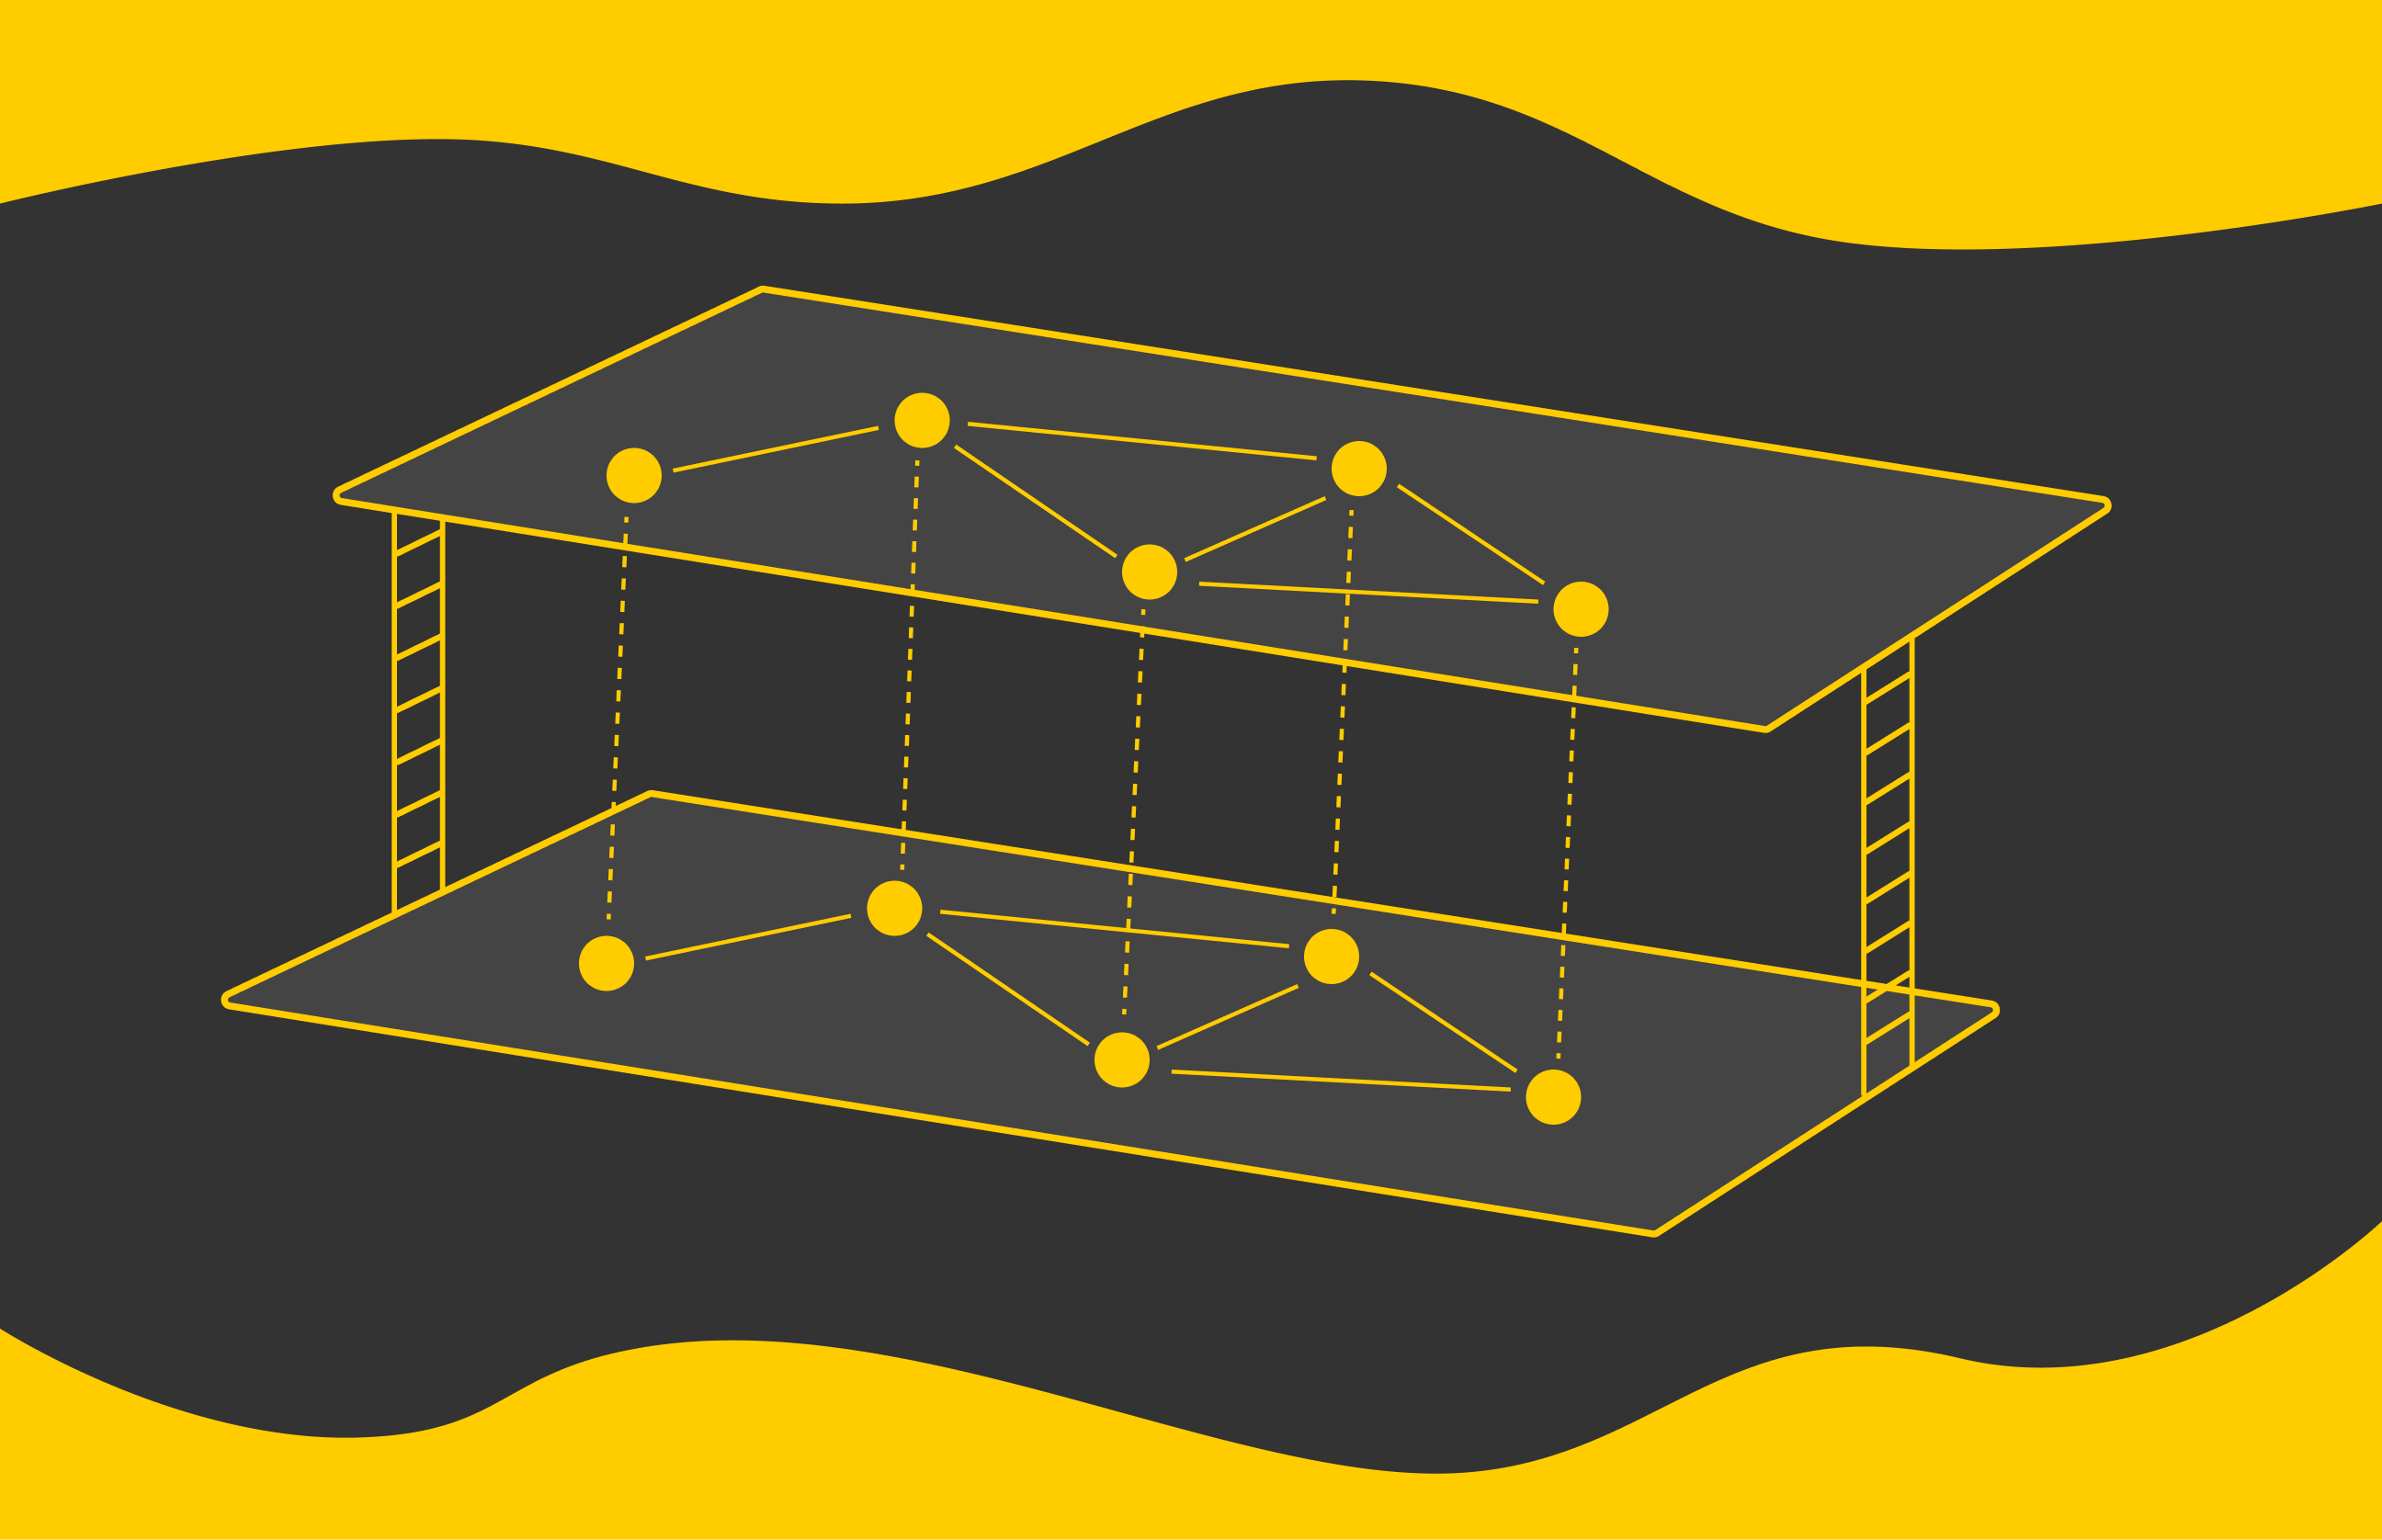
Explore How Graph Neural Networks Unlock Smarter Data Connections
Graph neural networks can feel like a black box, but they don't have to. This visual guide breaks down GCN, MPNN, and GAT by showing exactly how they pass messages and weigh connections. It's a clear, practical look at the mechanics, and it's perfect for anyone ready to move beyond spreadsheet mental models. For a broader perspective on how AI structures complex information, you might also explore our related guide on paragraph structure in LLMs.

Build a Knowledge Layer Where Every Query Traverses a Living Graph
Most retrieval systems treat query wording as the failure point, but this approach argues otherwise: retrieval quality should be a property of the system, not the question's phrasing. By rebuilding the knowledge layer with graph traversal on every query, bitemporal edges, and two-threshold entity resolution, the architecture shifts the burden from user precision to systemic design. It's a pragmatic, future-focused move. For a deeper look at how structure shapes AI navigation, our related piece on paragraph structure in LLMs pairs well here.
Transform your survey data into clear before and after charts with AI
Struggling to line up headers and values for a before-and-after chart is a familiar snag, especially when the goal is a clean, stacked visual. The trick often lies in how you structure the source data, not the chart type itself. Reshape your questionnaire results into a simple table with categories as rows and time points as columns, then let Excel handle the rest. It's a small step that turns a frustrating task into something intuitive.

How Stripe Uses Graphs and State Machines to Automate Database Recovery
When Stripe's database misbehaves, they don't wait for a human to save the day. Their engineering team models the entire global infrastructure as a graph, then lets search algorithms find the problem while state machines execute the fix. That's a smart shift from reactive firefighting to automated recovery. It's practical, and it shows how mature AI-assisted operations have become. For more on putting intelligent automation to work, our guide on unlocking ChatGPT for work is worth a look.

Explore the tools and training shaping the future of agentic AI.
This week's roundup zeroes in on the tools and skills that actually move the needle, from top MCP servers for high-performance agentic development to Kaggle and Google's free five-day course. It's a practical lineup, and we appreciate that. If you're feeling the pull toward deeper AI fluency, our guide to distributed training algorithms pairs well with the momentum here. Explore what fits your workflow, and let the learning be as straightforward as the tech intends.
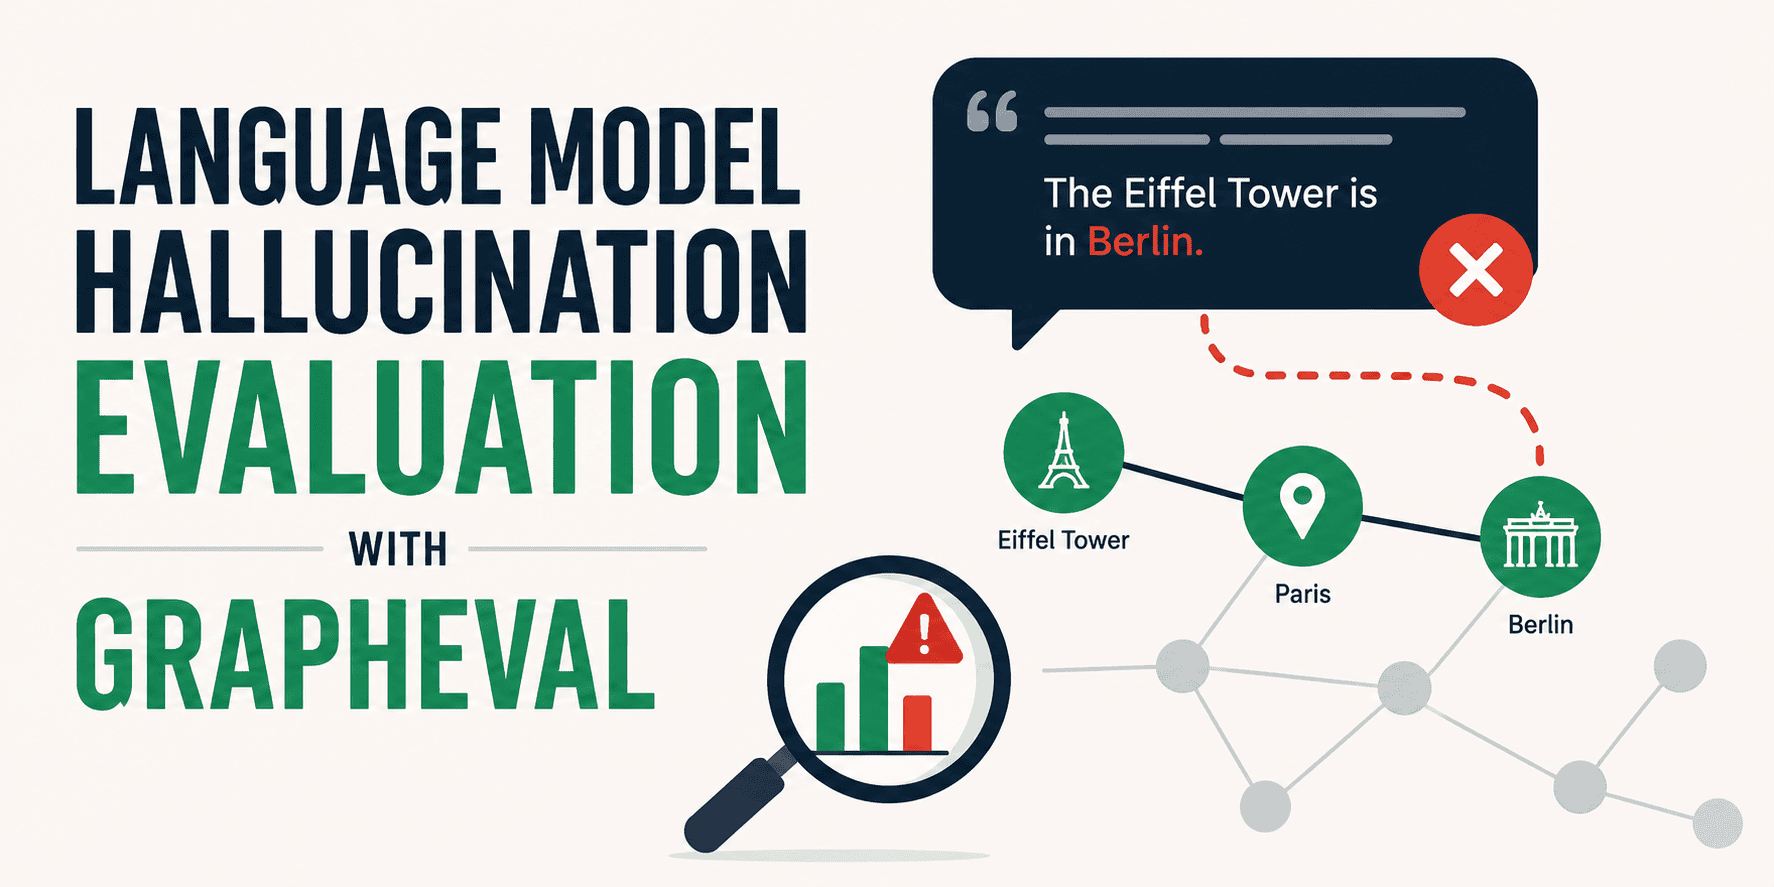
Explore how GraphEval maps the path to more reliable AI answers.
LLM hallucinations remain one of the most persistent barriers to trusting AI outputs, and GraphEval steps in to address that head-on. By turning its core principles and methodological stages into a practical scenario, GraphEval makes the evaluation process tangible rather than abstract. It's a useful lens for seeing how structured evaluation can expose where models go wrong and why that matters for real workflows. For readers juggling multiple AI concepts, our related piece on bridging retrieval and action offers another practical angle worth exploring.
Explore how GPT-2 maps tokens with an interactive visual graph.
There's a quiet thrill in tapping a single token and watching its nearest kin appear. This interactive map of GPT-2's token embedding space makes that possible, offering 32,070 alphabetic tokens to explore with a pinch or a tap. No forward pass, no context, just raw relationships laid bare. The t-SNE layout and minimum spanning tree ensure every line represents a genuine neighbourly bond. It's a hands-on way to grasp how the model organises language, and it works beautifully on mobile.