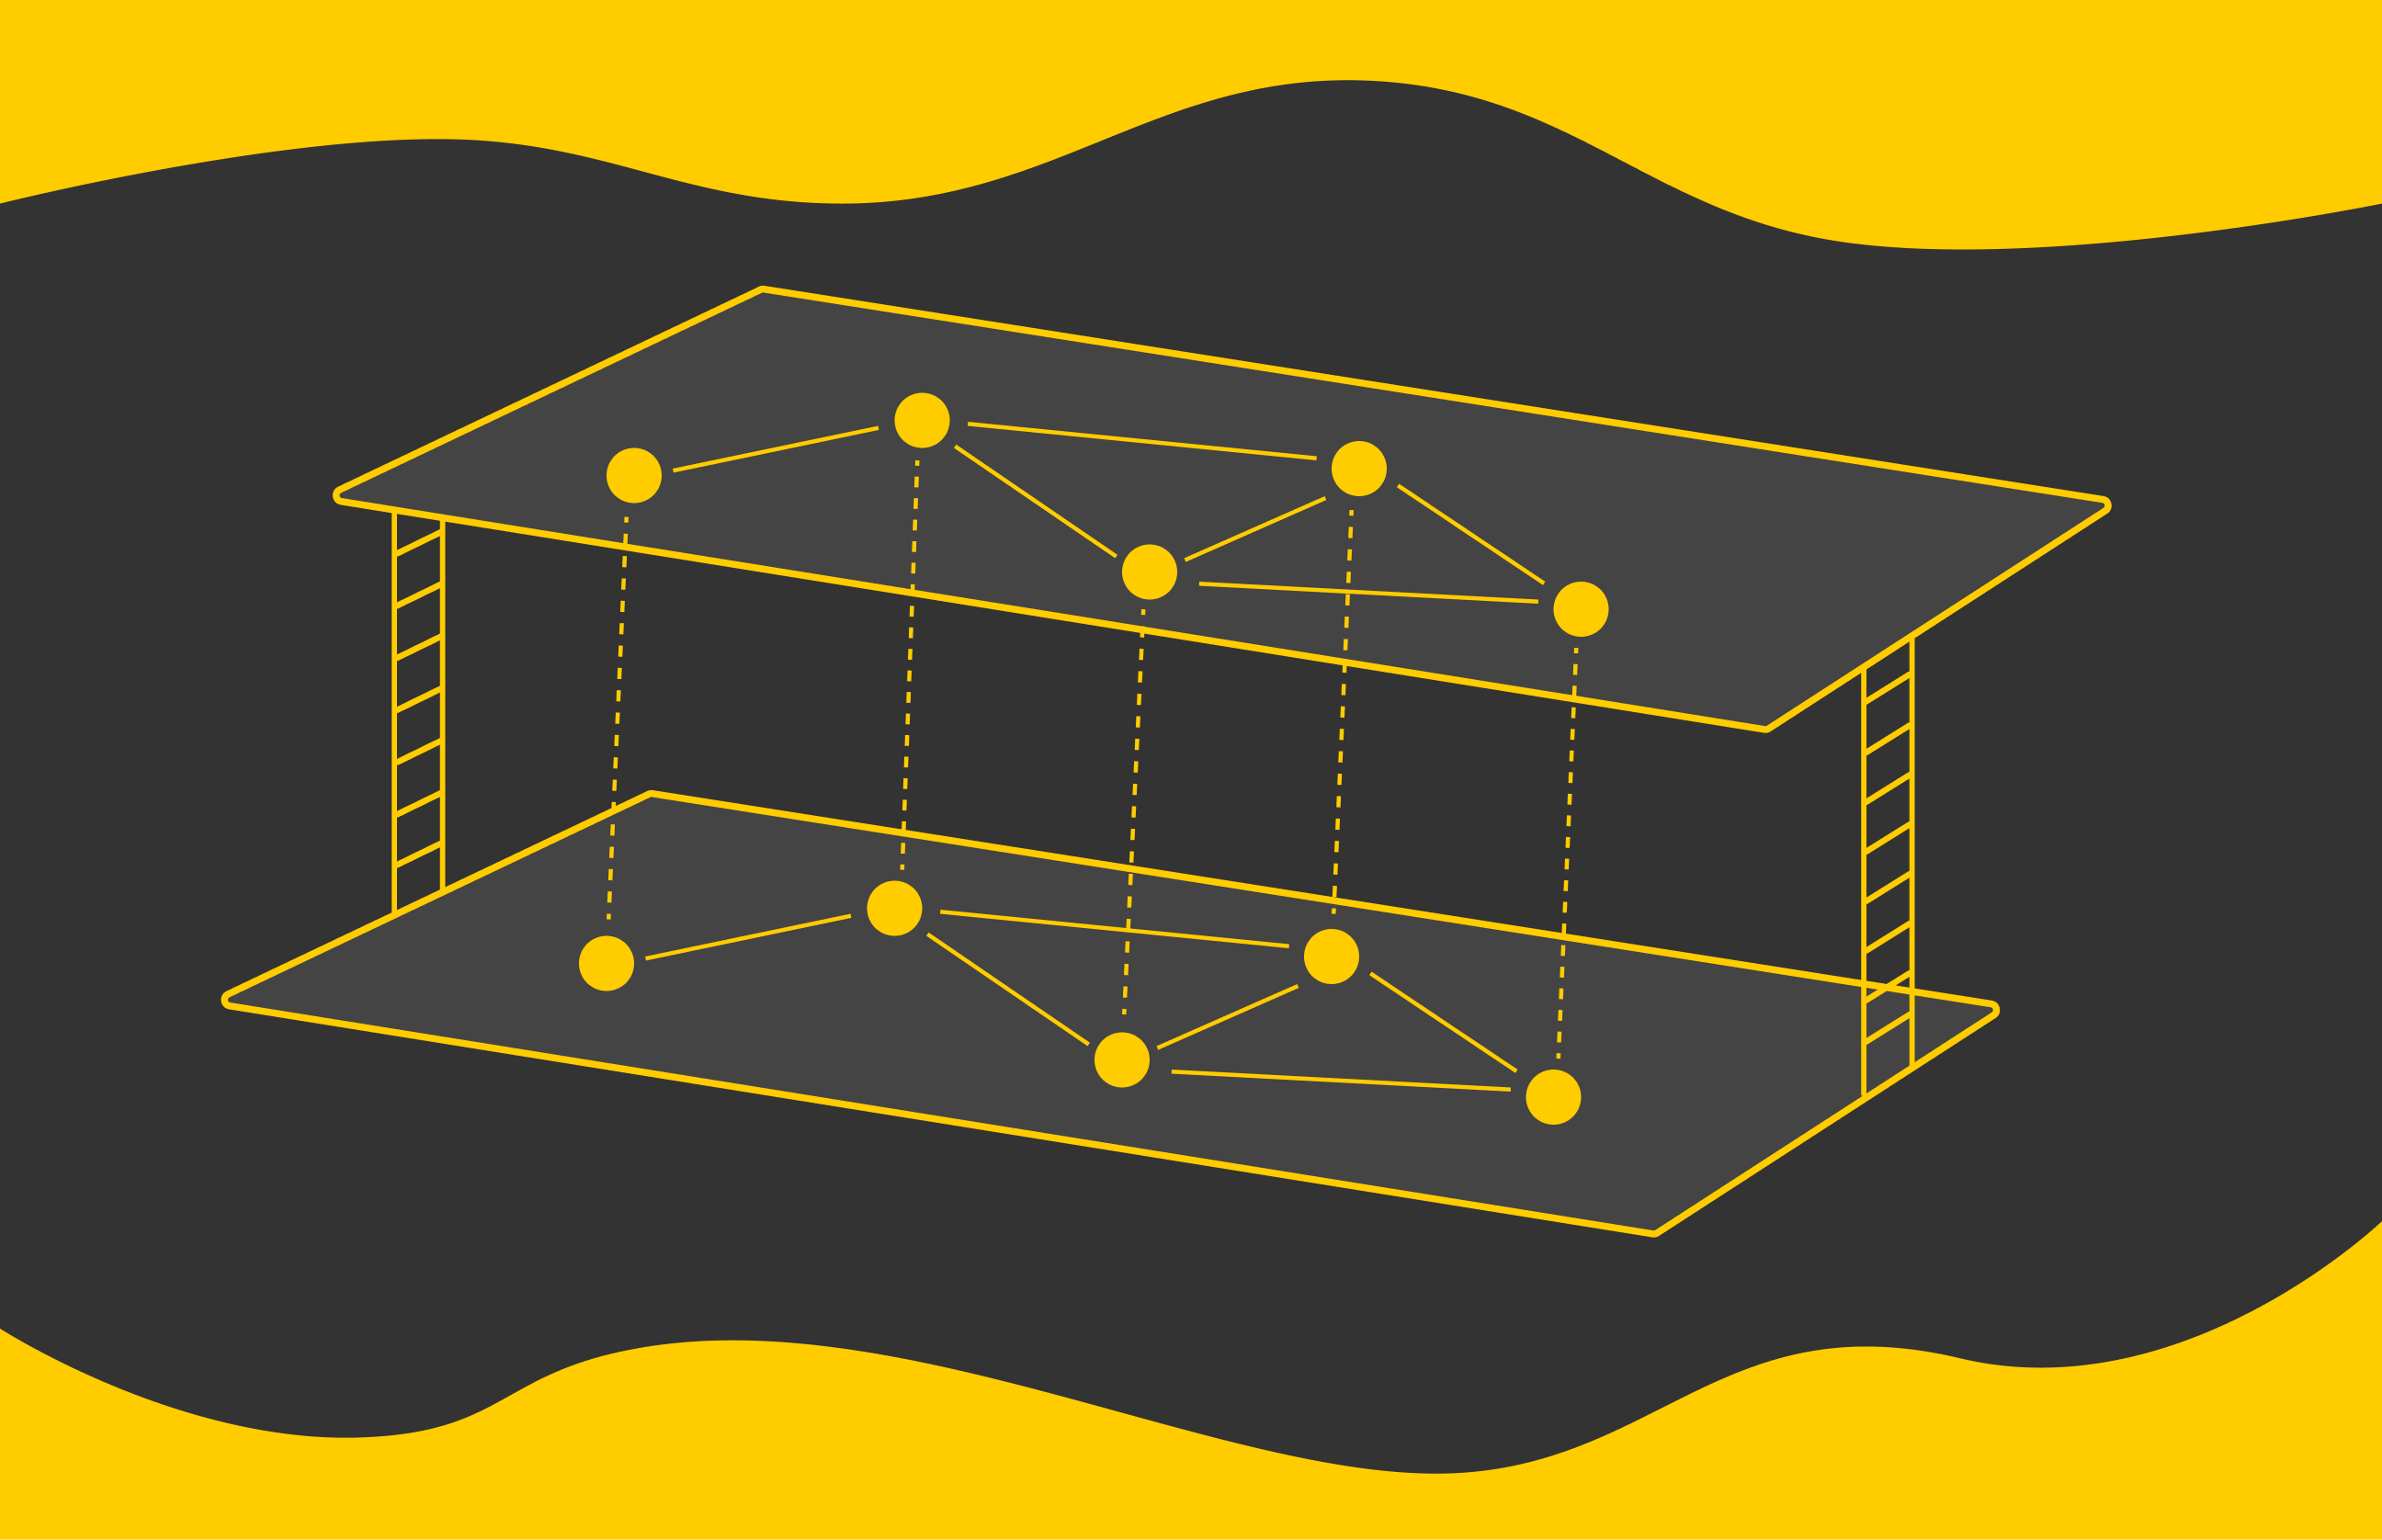
Graph neural networks have a PR problem. Ask most people working with data what a GCN or a GAT actually does, and you'll likely get a polite nod followed by a quick subject change. The math feels heavy, the diagrams look like abstract art, and the payoff seems distant. That's why the recent visual guide to GCN, MPNN, and GAT is worth your attention. It doesn't just explain the mechanics; it pulls back the hood and shows you the moving parts in a way that feels surprisingly approachable. And that matters, because graph neural networks are quietly becoming the backbone of recommendation engines, fraud detection, and molecular discovery. They're not a niche curiosity anymore. They're a practical tool you'll likely need to understand, even if your current spreadsheets aren't asking for them yet.
Here's where the connection to your daily work becomes clearer. The same way Unlock LLM Training: A Practical Guide to Distributed Algorithms breaks down the intimidating world of distributed systems into actionable steps, this guide does the same for graph structures. It meets you where you are: someone who gets the value of data but doesn't want to wade through dense equations to find it. The visual approach forces clarity. When you see how a message-passing network aggregates information from neighboring nodes, you start to understand why it's so effective at capturing relationships that tabular data flattens. And when you compare that to the self-attention mechanisms in transformer models, as explored in Exploring Paragraph Structure: How LLMs Navigate Token Space, you realize that both fields are wrestling with the same fundamental question: how do you make sense of context and connection? That's not just theoretical overlap. It's a practical bridge between two of the most impactful areas in modern AI.
Our take is straightforward: stop treating graph neural networks as a separate silo. The guide does more than explain three architectures; it gives you a mental model for thinking about relational data that applies far beyond the examples shown. If you've ever felt constrained by the rows-and-columns mindset, this is the unlock. The visual guide doesn't oversimplify the trade-offs between GCNs, MPNNs, and GATs, but it does show you why those trade-offs exist. And that's the kind of understanding that sticks. It empowers you to make informed choices when you eventually face a problem that doesn't fit neatly into a table. So if a colleague asks you what all the fuss is about, point them here first. But more importantly, ask yourself this: when you look at your own data, what are the connections you're missing? The answer might just be the graph you haven't drawn yet.