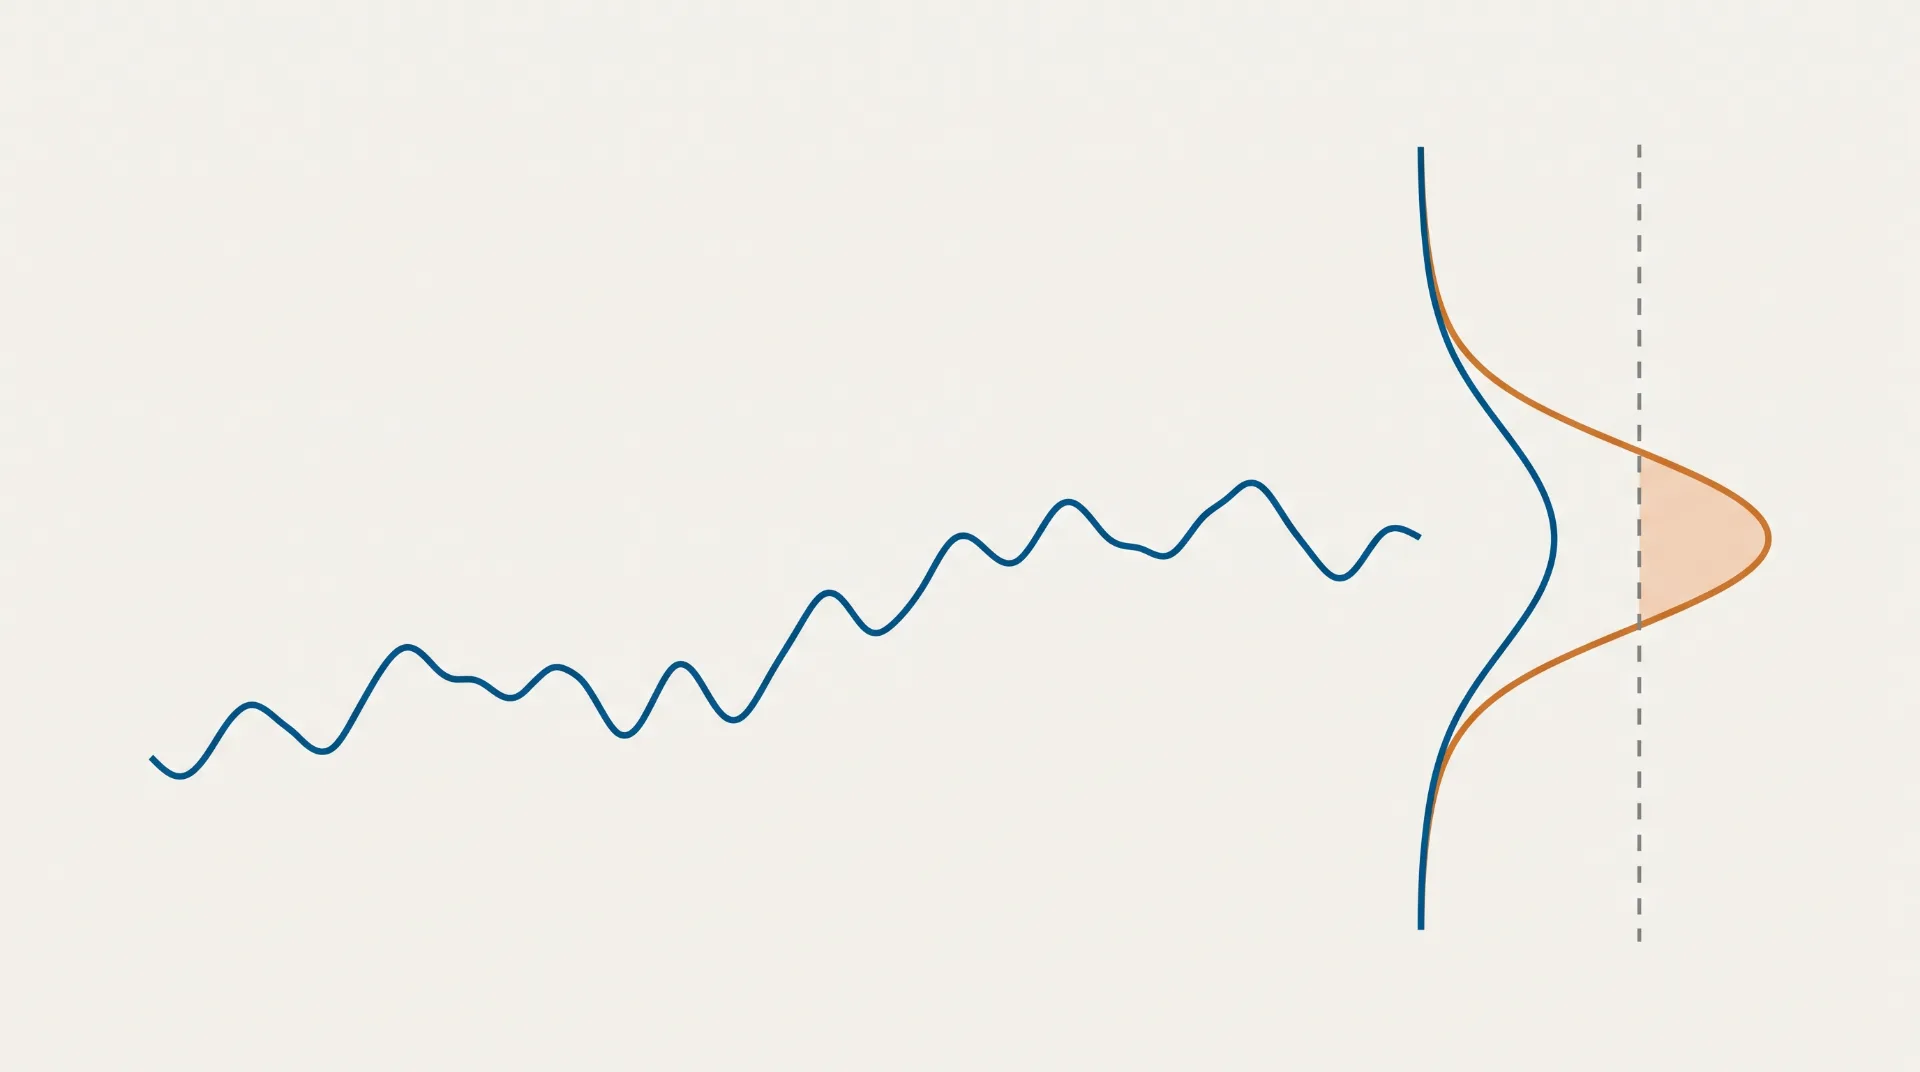
Mean squared error has a way of making us feel confident when we shouldn't. The post from Towards Data Science, kicking off a series on probabilistic forecasting for physical signals, argues that your model's MSE is lying to you, and we agree. It is not that MSE is useless, but that it gives a false sense of certainty precisely when the real world gets noisy, which is always. For anyone building forecasts from sensor data, energy loads, or any physical signal, this is the difference between a metric that looks good on a dashboard and a model that actually helps you plan.
The practical problem is straightforward. MSE averages errors across all your predictions, but it does not tell you how those errors are distributed. A model can have a low MSE while still being wildly wrong about the shape of the future, especially when the signal has spikes, dips, or sudden regime changes. Physical signals are rarely smooth, and they almost never follow a neat normal distribution. So when you optimize for MSE, you are implicitly assuming that the cost of being off by two units is the same in every direction and at every moment. That assumption breaks down fast when you are forecasting temperature, wind speed, or electricity demand. The point is not to throw MSE away, but to stop treating it as the final word. Instead, you need to know the full probability of what could happen next, not just the single most likely number. This is where probabilistic forecasting comes in, and it is the next step the series promises to explore.
For our readers, the takeaway is direct: if you are still evaluating your physical signal models with point metrics alone, you are flying blind. You might be hitting your MSE target and still be unprepared for the actual range of outcomes. The good news is that the fix is not more data or fancier architectures, but a shift in how you frame the problem. Ask your model for a distribution, not a point. That means looking at quantiles, prediction intervals, or full density estimates. The next step is multi-step rolling forecasts, which is where this really gets interesting, because errors compound and the uncertainty grows with each step. If you want to get ahead of this, start reading up on probabilistic forecasting methods and how they apply to physical signal processing. Also, revisit how evaluation metrics can mislead when they ignore the underlying distribution.
The specific detail to watch in the next installment is how the uncertainty evolves when you roll the forecast forward. A single-step probabilistic model might be calibrated well, but the moment you chain predictions, the intervals can collapse or explode. That is where MSE really lies, because it hides the fact that your model's confidence is not stable. So, the question to hold onto is this: when your forecast horizon extends, does your uncertainty grow at the right rate? If you are not checking that, you are still being lied to, just with extra steps.