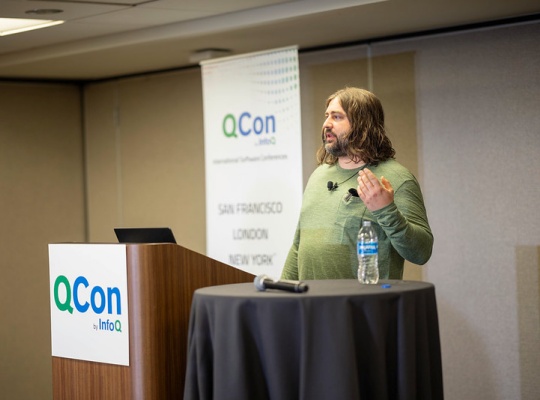
Most engineering teams treat instrumentation as an afterthought. You bolt on a metrics library, watch the dashboards light up, and only later discover that the very tool meant to grant visibility is quietly taxing your production systems. Brian Martin's presentation on low-overhead instrumentation at scale speaks directly to this pain point. He isn't selling another dashboard or a flashy APM tool; he's addressing the fundamental tension between wanting complete observability and refusing to pay for it with degraded performance. For teams wrestling with distributed systems, this is the difference between guessing at bottlenecks and actually seeing them in real time. Martin's work at IOP Systems focuses on practical techniques like atomic primitives, per-CPU sharding, and lock-free histograms. These aren't academic exercises. They are the building blocks for what he calls "fearless" instrumentation, where the act of measuring doesn't change the thing being measured.
What makes his approach stand out is the refusal to accept the usual trade-off. Most teams assume that deeper instrumentation means higher overhead, and higher overhead means you pick your battles. Martin challenges that assumption by showing how careful engineering of the metrics layer itself can sidestep the performance cliff. His exploration of per-CPU sharding, for instance, reduces contention by giving each core its own slice of data, which is a straightforward but often ignored pattern. Lock-free histograms further cut the latency cost, making it feasible to collect rich data without stalling the hot path. This is the kind of detail that matters when you're running services at scale, where a few microseconds per operation can compound into noticeable latency or inflated cloud bills. It also aligns with broader trends in observability, like what you see in Unlock LLM Training: A Practical Guide to Distributed Algorithms, where the underlying health of a system depends on how well you can inspect its components without disturbing them.
The eBPF integration Martin mentions is particularly telling. It signals a shift toward kernel-level visibility that doesn't require invasive code changes. That's a powerful idea for engineering leaders who are tired of chasing regressions caused by their own monitoring stack. But here's where we'd push back: adopting these techniques isn't a plug-and-play solution. It requires a team that understands the internals of both their runtime and the kernel. The payoff is real, but it demands a level of investment that not every organization is ready for. For teams still in the early stages of their observability journey, the practical first step isn't to rebuild your metrics pipeline from scratch. It's to audit where your current instrumentation is actually spending money and CPU cycles. Compare that with the approach in Monitor Cypress Tests with Grafana: Persistent Observability for Your Data, which shows that even test-level observability can be made persistent without grinding your CI pipeline to a halt. Both cases share a common thread: good instrumentation is designed, not accumulated.
The real takeaway from Martin's talk is that you don't have to choose between having performance and having visibility. The tools and patterns exist to get both, but they require a deliberate, informed approach. So before you accept that high overhead is the price of insight, ask yourself if you've really exhausted the low-level options. Because the next time your metrics library becomes the bottleneck, the answer won't be to instrument less. It will be to instrument smarter. And that's a distinction worth measuring.