Excel alternatives
Beyond Market Intelligence keeps Excel alternatives in one place: 87 stories so far. The section currently leads with “When Spreadsheets Slow Down, Explore Smarter Ways to Move Forward”, “From raw data to interactive dashboard: build your first Power BI report”, and “Stop Overthinking Python Courses and Start Learning”. Dealing with a bulky spreadsheet can be challenging, especially as complexity increases and performance slows. Welcome to our Power BI tutorial, where you’ll transform a raw data file into a polished, published report. Acme AI is the next-generation, AI-powered spreadsheet platform built to replace Excel and redefine how analysts, data scientists, and enterprise teams work… The list below is every Excel alternatives story on Beyond Market Intelligence, newest first.
When Spreadsheets Slow Down, Explore Smarter Ways to Move Forward
Dealing with a bulky spreadsheet can be challenging, especially as complexity increases and performance slows. As you approach 500,000 formulas, it's essential to explore strategies that enhance efficiency while maintaining clarity. Consider the impact of array formulas, the potential benefits of VBA for automation, and the advantages of using the LET function for repeated lookups. By re-evaluating your current approach, you can simplify workflows and reduce lag, ensuring your data analysis remains effective and responsive. Let's dive into practical solutions to optimize your spreadsheet experience.
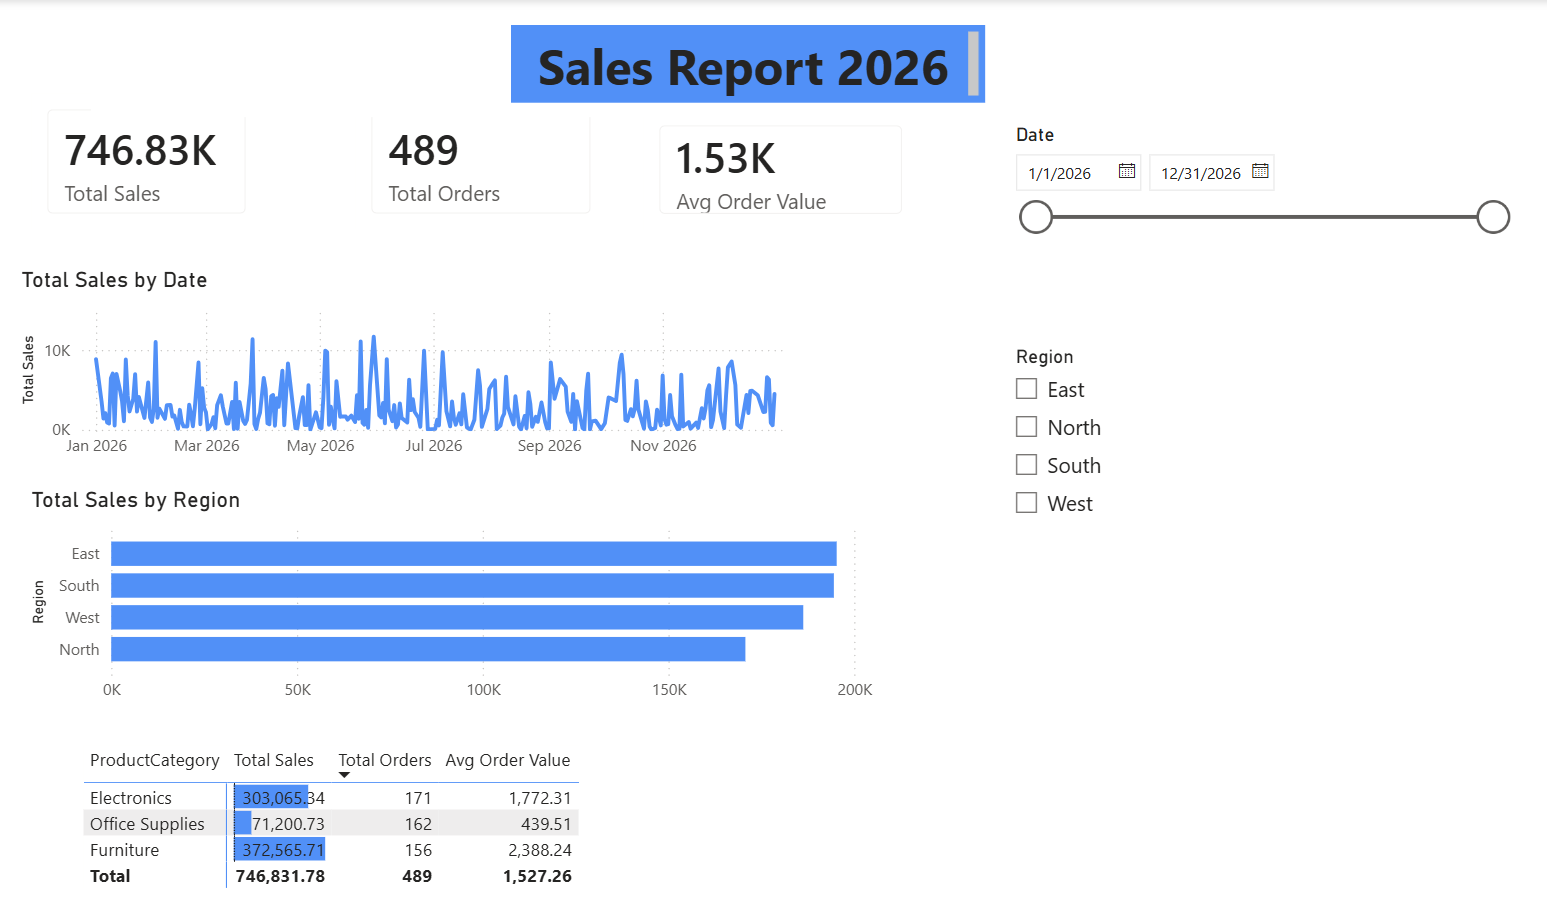
From raw data to interactive dashboard: build your first Power BI report
Welcome to our Power BI tutorial, where you’ll transform a raw data file into a polished, published report. This guide will walk you through the entire process, from initial data queries to deploying your finished dashboard in the cloud. You’ll learn to create an interactive dashboard that not only visualizes your data effectively but also includes essential features like alerts and automatic refresh settings. By the end, you’ll have the skills to empower your data storytelling and enhance your decision-making. Let's dive in and explore!

Stop Overthinking Python Courses and Start Learning
If you're exploring Python courses, you might feel overwhelmed by the sheer number of options available. With countless "best of" lists offering differing opinions, it's easy to fall into choice paralysis, which often prevents beginners from taking that crucial first step. This guide is designed to simplify your decision-making process by comparing nine standout Python courses in 2026.

Building Local-First Web Apps Without the Hype
In 2026, the landscape of web development is evolving, and local-first applications are at the forefront of this transformation. This perspective offers seasoned developers an honest look at the architecture of local-first web apps, addressing common skepticism surrounding quick fixes and silver bullets. By exploring the benefits and challenges of this approach, we aim to empower developers to navigate the complexities of modern web architecture with confidence. Join us in discovering how local-first strategies can enhance user experiences and redefine productivity in web development.

Discover how Poolide's open model makes agentic coding more accessible.
American AI startup Poolside has made waves by launching Laguna XS.2, a free, high-performing open model optimized for local agentic coding. Unlike proprietary giants, Poolside’s new offering emphasizes affordability and accessibility, allowing developers to run the 33-billion parameter model on personal hardware without an internet connection. This innovative release, alongside the Laguna M.1 model, positions Poolside as a key player in the open AI landscape, inviting the community to experiment and build on cutting-edge technology designed for real-world applications.
Sync live data across columns with real-time filtering clarity.
In this scenario, you aim to sync columns C (Assigned Codes) and D (Positions) with the filtering systems of columns A (Country) and B (Leader Assigned). Using dynamic array filters allows real-time updates from the source workbook, but you face a challenge: the codes and positions do not align correctly when filtering. As a result, selecting a country like the USA only reveals partial data. We'll explore solutions to effectively map these columns to ensure accurate filtering and complete visibility of your data.
Unlock Your Municipality Data with Custom Map Imports
Creating unique visualizations in Excel 365 can be challenging, especially when working with specialized maps, like a municipality divided by parishes in Portugal. While Excel has robust mapping capabilities, it may not support all external map formats, such as DWG or various GIS formats like Shapefile and KML. Importing these maps directly into Excel is not straightforward. However, exploring alternative methods or creating your charts in CAD software could streamline your workflow.
Transform Your Data: Turn Columns into Clear Multi-Series Line Charts
Creating multiple line charts in Excel can enhance your data visualization, but it often requires careful arrangement of your data. To plot each series from Column A against the Sampling Date on the x-axis and your chosen variable from Columns C-E on the y-axis, you’ll need to ensure Excel recognizes these series correctly. If your initial attempt resulted in a single series, consider exploring features like PivotTables or the "Data Table" function to automate the rearrangement of your data.
Transform Your Pivot Table to Show Lot Codes as Text, Not Zeros
If you're working with Pivot Tables and encountering issues with Lot codes displaying as zeros instead of their intended text, you're not alone. This common challenge often arises when numeric formats are incorrectly applied to text data. Fortunately, there are settings and techniques to ensure that your Lot codes are displayed correctly. By adjusting the field settings or exploring alternative methods to attach the Lot codes, you can effectively consolidate your company database and enhance your data analysis.
From 20 steps to one: rethinking how we handle spreadsheet macros
Transitioning to a non-clinical role in a public health care system can be challenging, especially when navigating legacy VBA macros with limited documentation. A cumbersome workflow, involving multiple steps from data extraction to running macros, can hinder productivity. As a newcomer, you might feel overwhelmed by the complexities of these tools. However, exploring alternatives like Office Scripts in TypeScript could streamline your processes, making them more manageable.
Stuck Rows Won't Delete? Clear the Data, Not the Frustration
If you're facing issues with deleting rows in your Excel dataset, where only the cell content disappears but the empty row remains, you're not alone. This frustrating challenge can disrupt your workflow, especially when it affects multiple sheets. Common solutions like using Ctrl + - or converting to tables may not always resolve the issue. Understanding the root cause can help restore your productivity and peace of mind. Let's explore possible explanations and effective strategies to regain control over your data management.
Step into the ring with a fully playable boxing sim built right in Excel.
Introducing my boxing simulation game, created entirely in Excel, where you can experience the thrill of the ring right from your computer. After refining my initial concept, I’m excited to share the playable file and gameplay video. Your feedback on performance and pacing would be invaluable, especially regarding the commentary system I've developed to enhance the experience. This project represents two months of dedicated work, and I look forward to discussing its features and improvements.

Open Weights, Clear Path: Trinity Gives Enterprises a U.S.-Made AI Choice
Arcee has unveiled Trinity-Large-Thinking, an innovative 399-billion parameter AI model designed for enterprises seeking customization and control. Released under the open Apache 2.0 license, this U.S.-made model empowers developers to tailor solutions without the limitations of proprietary systems. As competitors shift toward closed architectures, Arcee positions itself as a leader in the open-source AI landscape, addressing the growing demand for domestic alternatives.
Unlock Smarter Filtering for Messy Data Without Changing Your Workflow
If you're grappling with filtering data in an Excel report generated from less-than-ideal software, you’re not alone. The challenge arises when filtering for specific names, like Bob, inadvertently hides crucial comments associated with those entries. Instead of relying solely on the standard filter function, consider alternative approaches, such as using advanced filtering techniques or creating a pivot table. These strategies can help you view Bob's name alongside his comments seamlessly, transforming your data into a more user-friendly format.

Turn team chat into a secure foundation for your AI agents
Imagine a workspace where your Teams or Slack messages seamlessly transform into secure context for your AI agents. PromptQL is redefining the digital workspace by addressing the inefficiencies of traditional tools, turning casual conversations into actionable insights. This AI-native platform captures team interactions organically, creating a shared memory that enhances collaboration and productivity. By automating task assignments and maintaining a living internal wiki, PromptQL empowers organizations to move beyond mere communication, fostering a future-focused environment where AI and human efforts align effortlessly.
Streamline Your Workflow by Taming Inconsistent Keyboard Shortcuts
Inconsistent keyboard shortcuts can be incredibly frustrating, especially when they disrupt your workflow. Many users, like yourself, encounter different scrolling behaviors between Excel and SharePoint, leading to accidental zooming and confusion. While the Ctrl+Shift+Mousewheel shortcut works seamlessly in Excel, it reverts to zooming in SharePoint, causing unnecessary interruptions. If you're struggling to find a solution or adjust settings to create consistency across both platforms, you're not alone. Let's explore options that could help streamline your experience and enhance your productivity.
From spreadsheet logic to a web app built for your financial clarity.
I’m excited to share my professional expense tracker along with a web app I created to automate the process, both available for free. After years of refining a powerful spreadsheet that provides a clear annual view of my cost of living and savings rate, I sought to enhance that experience. Many existing apps fell short of my needs, so I designed a solution that maintains the expansive feel of a spreadsheet while streamlining workflows.
Discover how AI transforms Excel workflows from manual refresh to automatic insight
Welcome to this week’s recap of /r/Excel for March 21 - March 27, 2026. Dive into the top discussions, including tips on automating Power Query refreshes in SharePoint and engaging debates about nested arrays and alternatives to grouped rows. Unsolved queries, like filtering duplicates and tracking workouts in spreadsheets, highlight the ongoing challenges users face. Explore the insightful comments that have sparked conversations, offering solutions and shared experiences within the Excel community. Join us as we navigate the latest trends and insights in Excel productivity!
Extract unique values from messy data without complex formulas
If you're working with a column of pipe-separated values and need to extract all unique entries, you're not alone. For instance, with a dataset like "A|D," "B|A," and "C," your goal is to achieve a unique list of A, B, C, and D. While the standard approach using TEXTJOIN and TEXTSPLIT can be effective for smaller datasets, it faces limitations with larger, lengthy strings. Let’s explore practical alternatives to help you efficiently pull unique values without hitting character limits, ensuring your data management remains streamlined.
Color your bar charts by day with simple, intuitive controls
Are you looking to vary the colors of your bar graph in Excel by day of the week? It’s a common challenge that many users face when trying to enhance their visual data presentation. While Excel offers a "vary colors by point" option, it often defaults to a limited palette that may not suit your needs.
Automate Excel data refresh without opening the file each time
If you're using Microsoft Forms to collect data that is recorded in Excel, leveraging the Graph API can streamline your workflow. However, if you're facing challenges fetching updated data programmatically, it can hinder efficiency, especially when running daily cron jobs. Without access to Power Automate, exploring alternative methods to retrieve your data seamlessly is crucial. This discussion aims to identify effective solutions that ensure you can access the latest information without manually opening Excel on the web, enhancing your overall data management process.
Simplify project cost estimation with an intelligent spreadsheet alternative.
Managing large datasets in traditional spreadsheets can be a challenge, especially when dealing with multiple layers of grouped rows. In your case, an Excel sheet with 4,000 items, complex labor costs, and extensive conditional formatting can lead to crashes and slow performance. Exploring modern alternatives could streamline your process. Solutions like web apps with integrated databases may offer a more efficient way to organize and filter data.
Why Your Excel Macro Works Locally But Fails from SharePoint
Hello everyone, I’m currently troubleshooting an issue with an Excel (.xlsm) file stored in SharePoint that relies on macros. While macros function perfectly when the file is copied locally, users encounter data validation errors when accessing it directly from SharePoint. This discrepancy raises questions about macro execution and data validation dependencies in this environment. I’m seeking insights on whether macros can fully run from SharePoint, potential causes for these errors, and the best practices for ensuring smooth functionality. Any guidance would be greatly appreciated.
Stop Blank Cells Slipping Past Your Data Validation Rules
If you're facing an issue with data validation in Excel 365, where error alerts for blank cells aren't triggered despite "Ignore blank" being unchecked, you're not alone. This situation often arises with tables containing year, month, and day columns. While your validation settings seem correct, encountering a lack of alerts for empty cells can be frustrating. In this discussion, we’ll explore potential causes and solutions, ensuring your spreadsheet achieves the desired functionality and effectively handles blank entries as you intend.