row zero
61 stories filed under row zero on Beyond Market Intelligence. The newest of them: “Ace Your Data Role Interview with Python Questions That Test Real Skills”, “Dropdowns Clipped Inside Scrollable Panels? Here's How to Fix It”, and “Chart your quarterly spending without waiting for every cell to fill”. Prepare to elevate your data role interviews with our comprehensive guide featuring over 40 Python interview questions and answers tailored specifically for data positions. Dropdown menus are essential for streamlined user interactions, yet they can encounter issues when placed inside scrollable containers. Acme AI is the next-generation, AI-powered spreadsheet platform built to replace Excel and redefine how analysts, data scientists, and enterprise teams work… The list below is every row zero story on Beyond Market Intelligence, newest first.
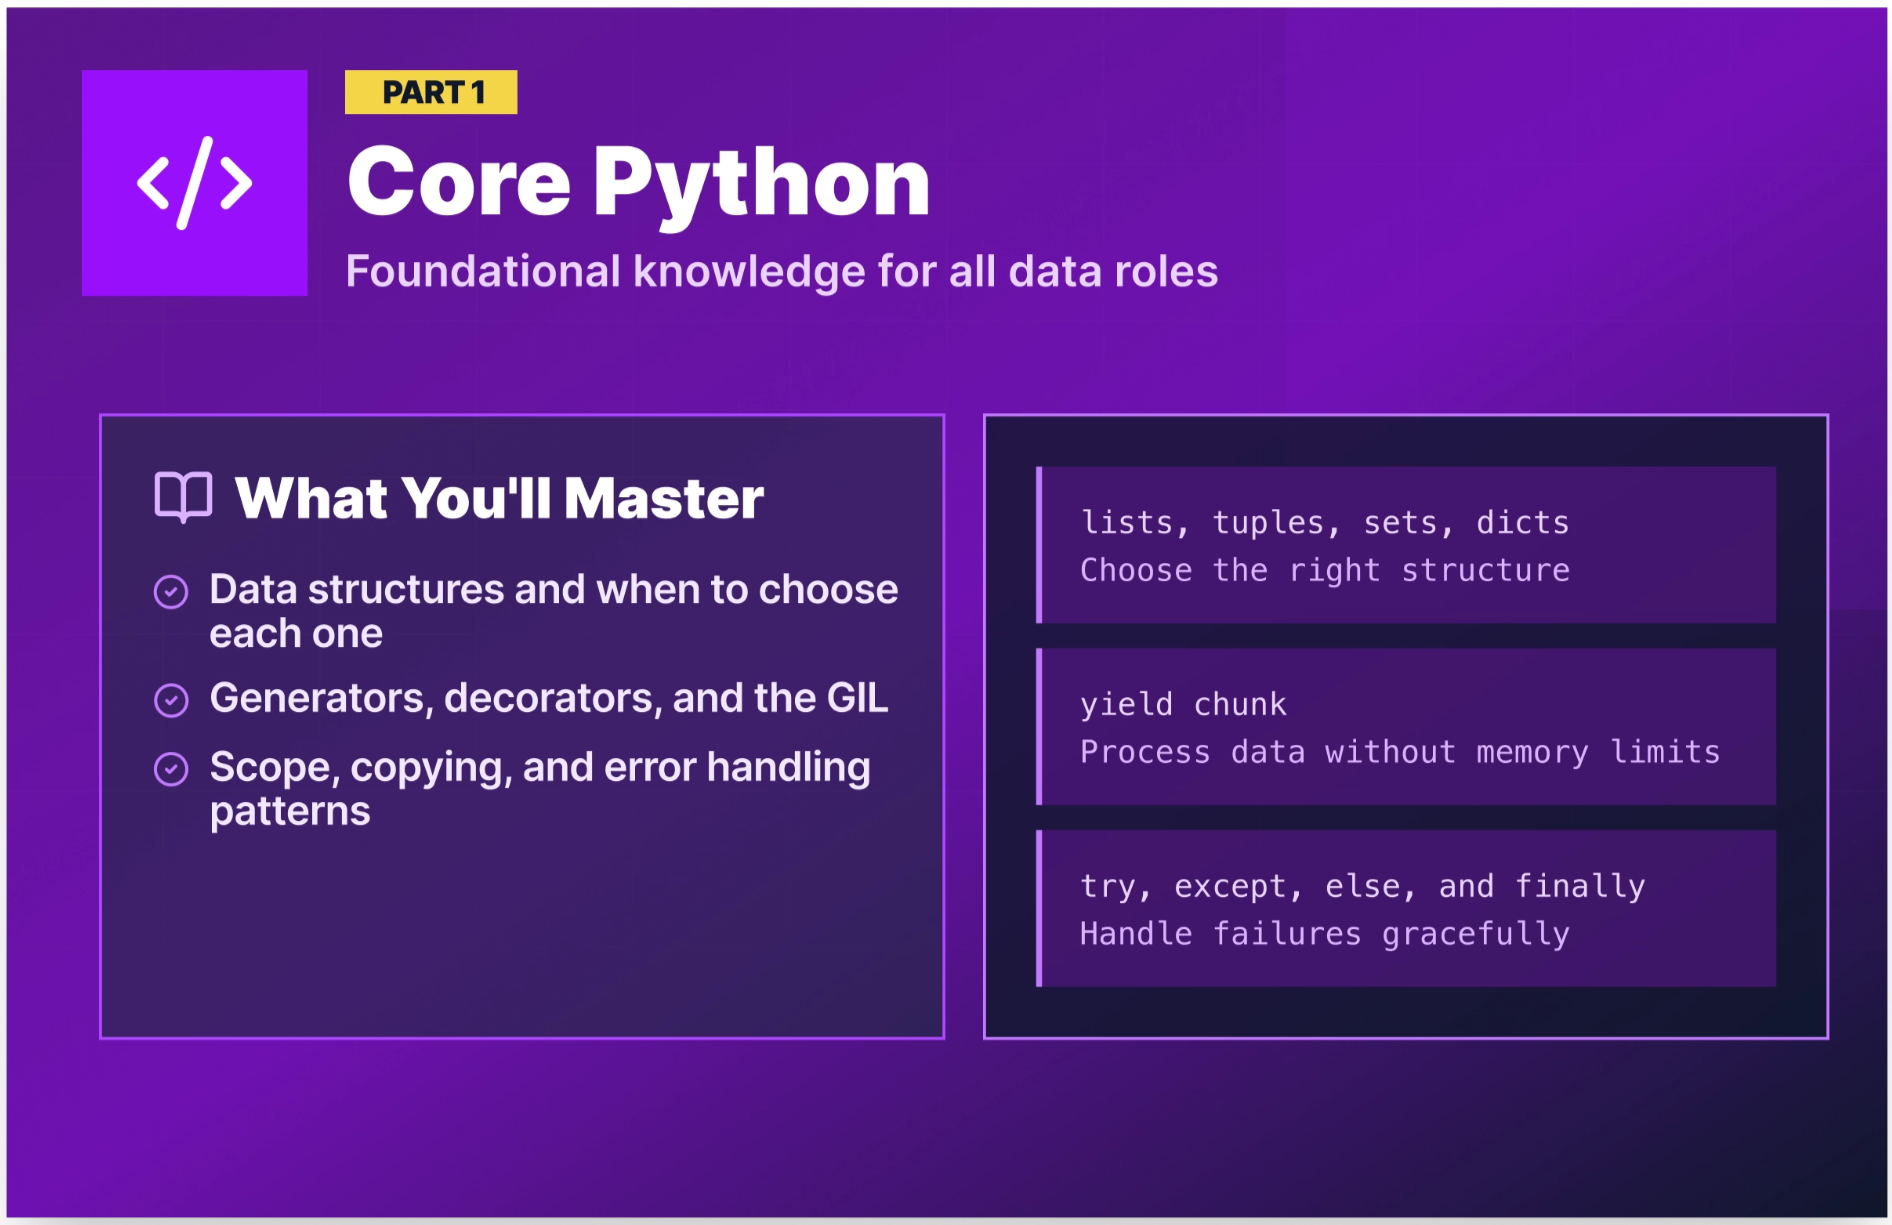
Ace Your Data Role Interview with Python Questions That Test Real Skills
Prepare to elevate your data role interviews with our comprehensive guide featuring over 40 Python interview questions and answers tailored specifically for data positions. Each question comes complete with a practical code example, a clear explanation of the underlying concept, and insights into what interviewers are truly assessing. Organized by role, this resource helps you concentrate your study efforts where they will be most impactful. With Python's prominence in data science and analytics, mastering these questions will empower you to showcase your skills confidently.
Dropdowns Clipped Inside Scrollable Panels? Here's How to Fix It
Dropdown menus are essential for streamlined user interactions, yet they can encounter issues when placed inside scrollable containers. Often, these dropdowns become clipped, causing critical options to disappear behind the panel's edge. In this insightful piece, Godstime Aburu delves into the reasons behind this problem and provides practical, actionable solutions to ensure dropdowns function seamlessly within scrollable environments. By understanding the mechanics at play, you can enhance user experience and maintain the accessibility of your interface. Discover how to resolve these challenges effectively.
Chart your quarterly spending without waiting for every cell to fill
Creating graphs with empty cells can be challenging, especially when you want to visualize cumulative spending without interruptions in the data. In your case, where a weekly data array tracks quarterly spending, it's essential to ensure that the line graph reflects only the available data while leaving space for future entries. To achieve this, you can modify your chart settings to handle empty cells appropriately, allowing the line to continue without dropping to zero.
Average across multiple conditions without the zeros slowing you down.
To streamline your data analysis, you can utilize the AVERAGEIFS function to calculate the average of values based on multiple criteria within the same row while excluding zeros. In your case, you want to average values in a row that meet specific header criteria—namely, "A" and "F." This approach not only simplifies your calculations but also ensures that irrelevant data, like zeros, do not skew your results. Embrace this method to enhance your spreadsheet efficiency and gain clearer insights from your data.
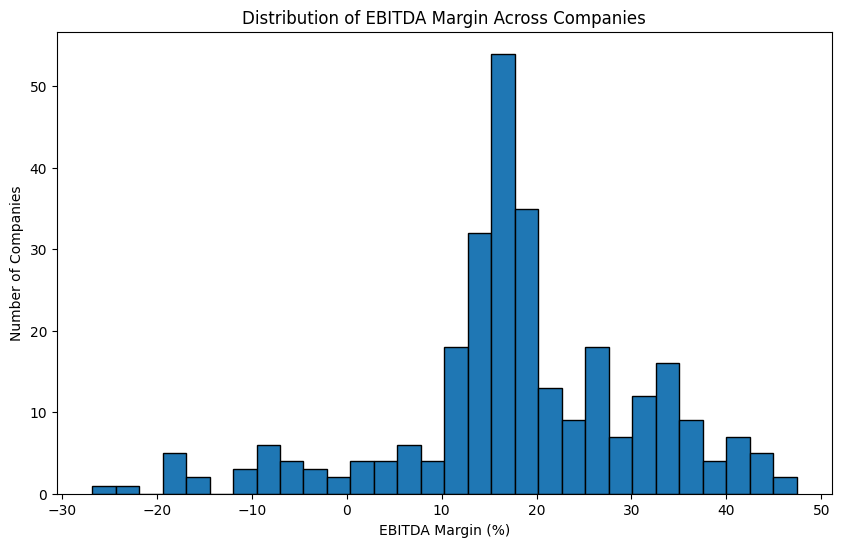
From Spreadsheets to Code: Explore Financial Data with Nasdaq's API
In the world of financial analysis, accessing data has often required cumbersome downloads or costly subscriptions. However, the advent of APIs has transformed this landscape. With just a few lines of Python code, you can effortlessly pull structured financial datasets from providers like Nasdaq, enabling you to begin your analysis in minutes. In this tutorial, we will guide you through the process of connecting to the Nasdaq Data Link API, empowering you to explore and leverage rich financial data with ease and efficiency.
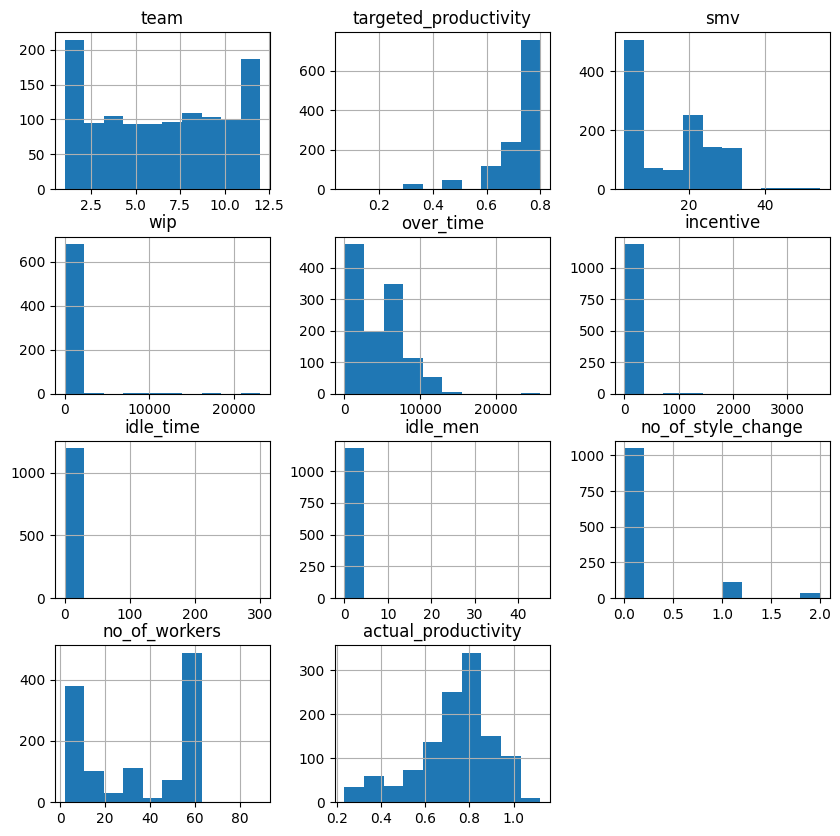
Empower Factory Teams by Predicting Daily Productivity with AI
Are you grappling with the challenge of predicting employee productivity in your factory? In this project tutorial, we’ll guide you through using decision trees and random forests to create a machine learning model that forecasts whether a workday will be productive. By analyzing team-level productivity data, you’ll uncover the key conditions that drive performance on the factory floor. Join us as we transform complex data into actionable insights that empower you to optimize productivity and enhance team outcomes. Let’s dive in!
Stop Wrestling Filters: Simplify Dynamic Array Logic with AI
Are you struggling to modify your dynamic array formula to eliminate unwanted criteria? You're not alone. Many users find themselves wrestling with formulas that seem to work perfectly until a minor adjustment creates unexpected results. In your case, it sounds like you're aiming to display yearly statistics without the frustrating row of zeros that appeared after your adjustments. Let’s explore how to refine your formula effectively, ensuring it meets your needs while maintaining clarity and precision in your data presentation.
Designing streaks that motivate, not manipulate, through smart UX psychology
Streak systems tap into the core of human psychology, making them both powerful and addictive. As users, we crave consistency and progress, and understanding this desire is key to designing effective streaks. In this insightful exploration, Victor Ayomipo delves into the UX principles that make streaks not just appealing, but transformational. Discover how to leverage these design strategies to foster engagement and motivation. Continue reading to unlock specific techniques that can elevate your product and keep users coming back for more.
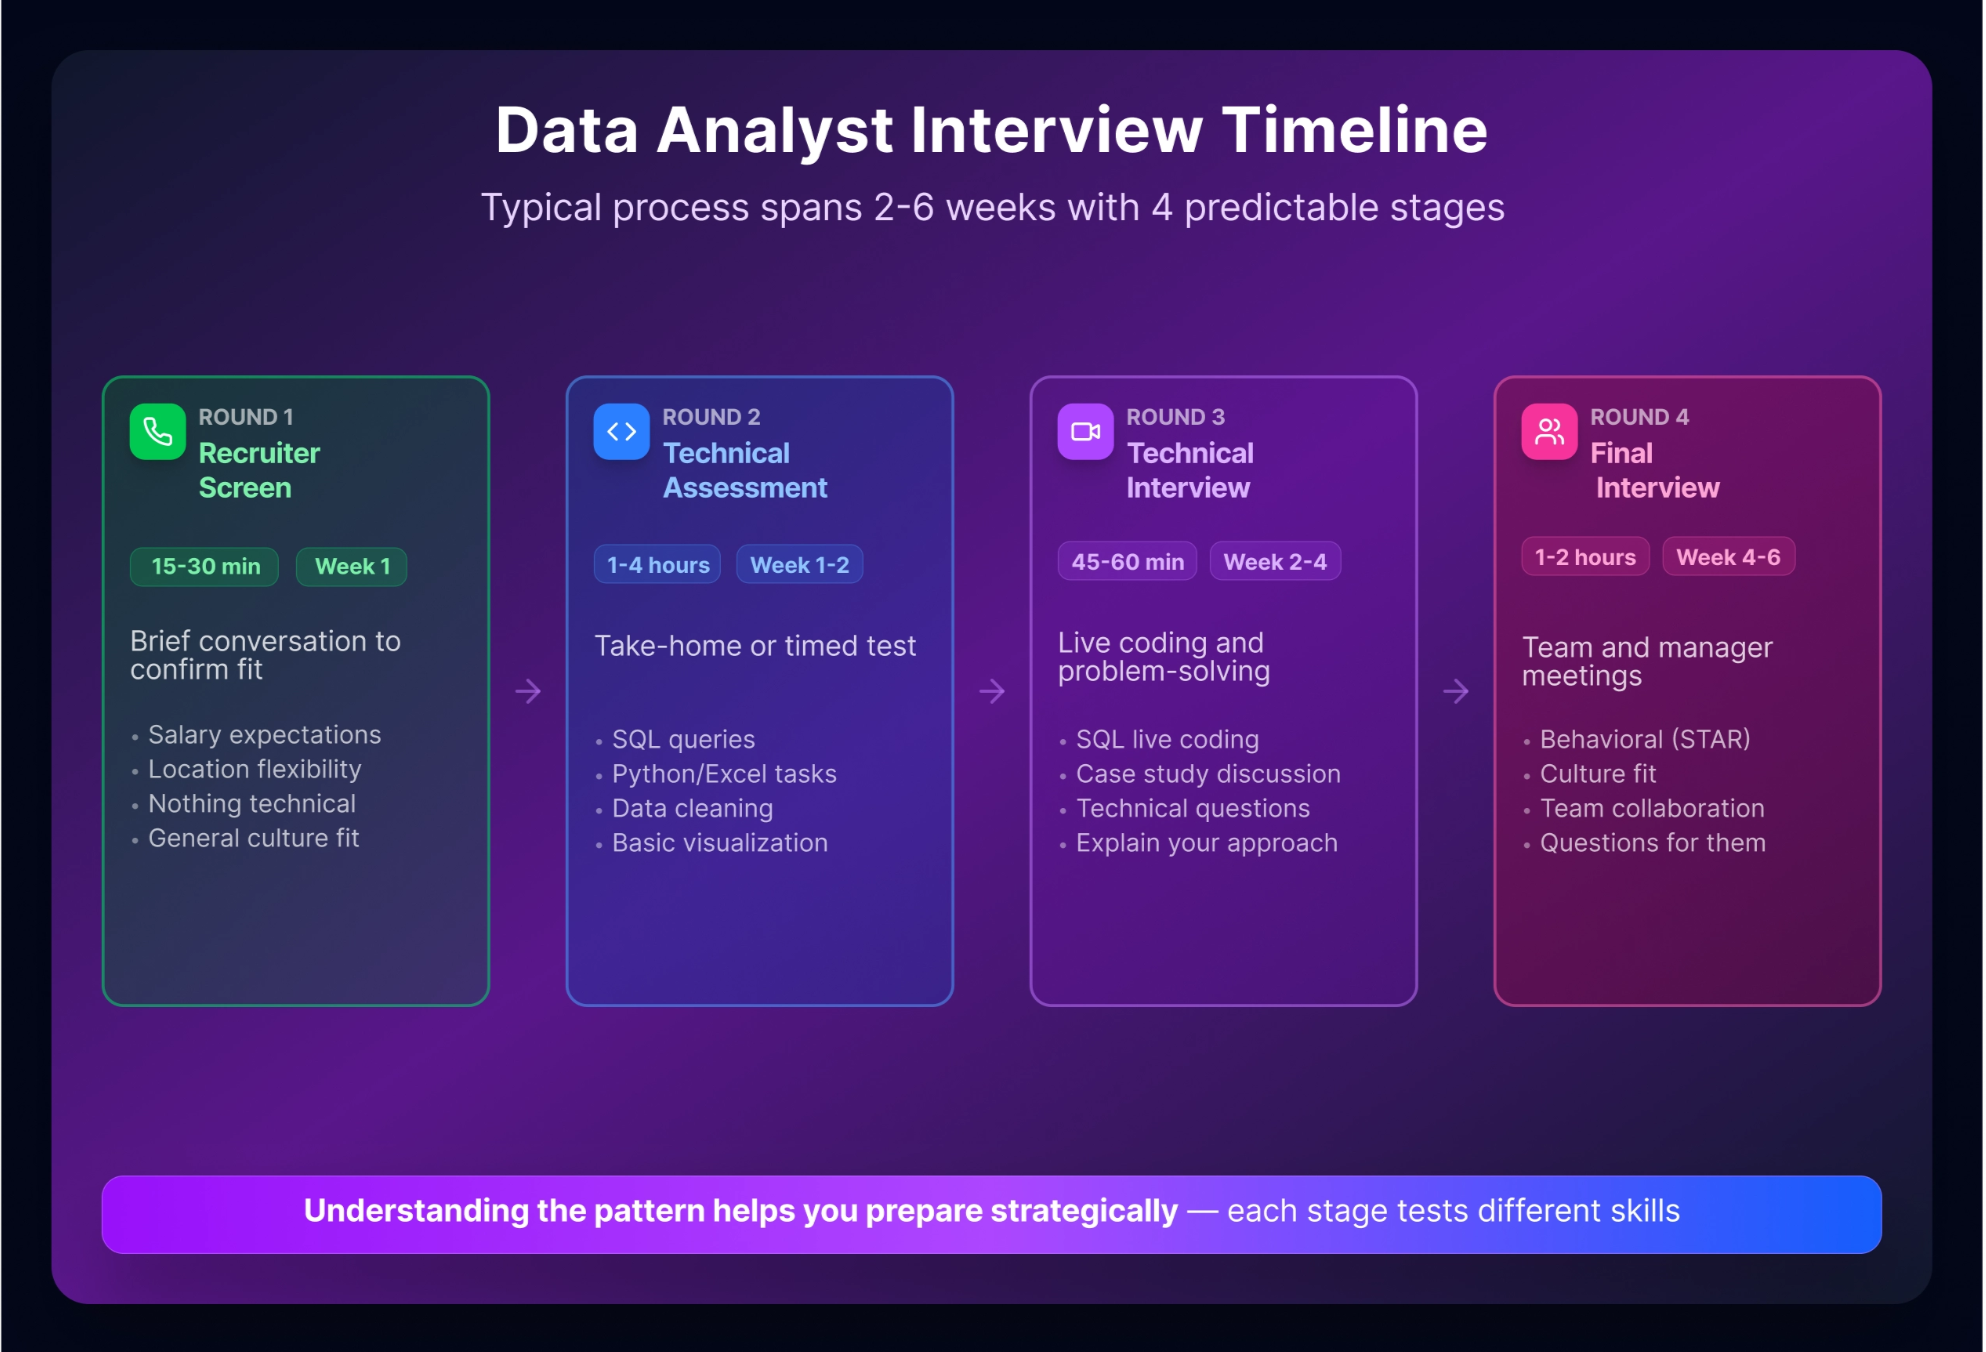
From SQL anxiety to interview confidence with 40 actionable questions
Preparing for a Data Analyst interview can be daunting, especially when self-doubt creeps in: "Am I ready? What if I freeze?" This guide alleviates those concerns by providing over 40 essential interview questions and answers tailored for entry-level candidates. With a strong foundation in SQL, Python, and statistics, you can confidently navigate the interview landscape. Dive in to discover the insights and strategies that will empower you to showcase your skills and secure that coveted position in 2026. Let’s transform your anxiety into assurance.
2,257 formulas, zero macros: a lesson in accessible spreadsheet architecture
Building a 2,257-formula workbook without VBA might sound daunting, but it reveals the power of formula-only architecture. Designed for restaurant managers, this project evolved from a simple P&L tracker into a robust tool that prioritizes accessibility over complexity. Key insights emerged, such as the versatility of SUMPRODUCT for multi-condition logic and the game-changing efficiency of named ranges. Plus, understanding conditional formatting order can save hours of troubleshooting.

Build a Knowledge Base Search System with Your New Vector Skills
Are you ready to transform your understanding of vector databases into a practical solution? In this project, you'll leverage your skills in chunking documents, filtering with metadata, and combining semantic search with keyword matching to create a robust knowledge base search system from the ground up. By collecting and organizing your own data, you'll not only reinforce your learning but also build a valuable tool that enhances information retrieval.
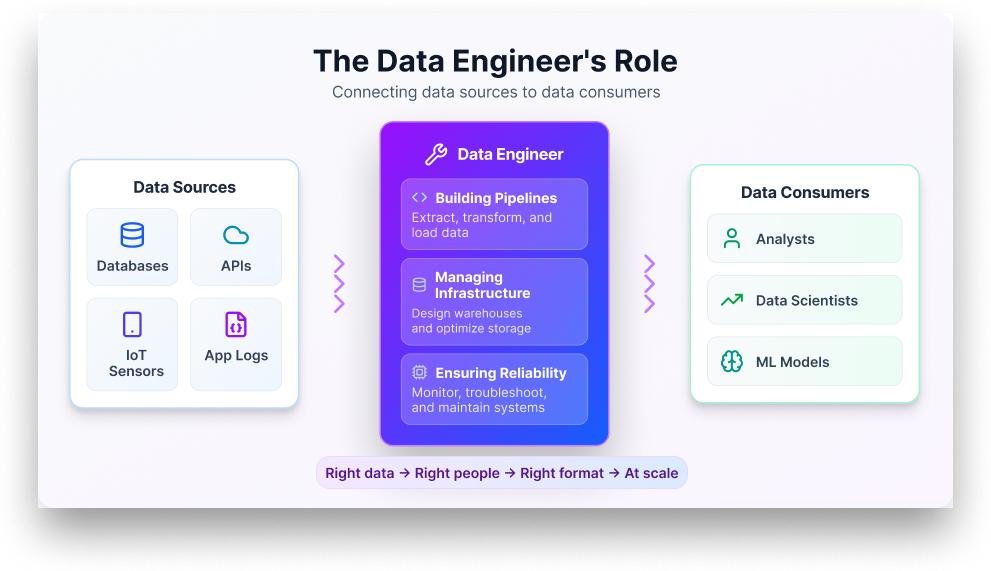
Build the Data Engineering Skills That Will Define 2026
Navigating the evolving landscape of data engineering can be daunting, especially with the endless array of skills like SQL, Python, Spark, and more vying for your attention. As we approach 2026, knowing which of these skills truly matters is essential for staying relevant in this fast-paced field. This guide not only highlights the 15 critical data engineering skills you need to thrive but also offers practical steps to build them.
Discover How CSS Masonry Simplifies Your Layout Workflow
Are you tired of relying on bulky libraries to achieve dynamic layouts on your websites? The arrival of CSS Masonry is set to transform how web developers create visually stunning and responsive designs without the overhead of traditional solutions. In this exploration, Patrick Brosset unpacks the exciting implications of this long-awaited feature, showcasing how you can seamlessly integrate it into your projects. Dive in to discover practical insights that will elevate your web development game and streamline your workflow—no library required!