row zero
61 stories filed under row zero on Beyond Market Intelligence. The newest of them: “When AI is confident but wrong, chaos testing reveals the real risk.”, “From Messy Listings to Clean Insights: Transform Your Data Workflow”, and “The enterprise security gap now has a price tag in shadow AI apps.”. Intent-based chaos testing addresses a critical gap in the deployment of autonomous AI systems. In this project tutorial, we will dive into the essential skills of cleaning and analyzing used car listings from eBay Kleinanzeigen. Acme AI is the next-generation, AI-powered spreadsheet platform built to replace Excel and redefine how analysts, data scientists, and enterprise teams work… The list below is every row zero story on Beyond Market Intelligence, newest first.

When AI is confident but wrong, chaos testing reveals the real risk.
Intent-based chaos testing addresses a critical gap in the deployment of autonomous AI systems. As illustrated by a recent incident involving an observability agent, traditional testing methods often overlook how AI behaves under unanticipated conditions. This framework shifts the focus from standard success metrics to evaluating behavior against intended outcomes. By deliberately injecting failure scenarios, organizations can uncover vulnerabilities before they impact production.
From Messy Listings to Clean Insights: Transform Your Data Workflow
In this project tutorial, we will dive into the essential skills of cleaning and analyzing used car listings from eBay Kleinanzeigen. Real-world data often presents challenges, such as prices stored as text, unrealistic year values, and columns lacking variation. These complexities can make analysis daunting, but they also highlight where the most impactful work occurs. Together, we will explore effective strategies to clean this messy data, transforming it into a valuable resource for insightful analysis and decision-making.

The enterprise security gap now has a price tag in shadow AI apps.
Recent research from Israeli cybersecurity firm RedAccess reveals the alarming scale of vulnerabilities associated with vibe-coded applications, exposing sensitive corporate data. With 5,000 apps identified, including those built on platforms like Lovable and Netlify, many remain publicly accessible due to lax privacy settings. These applications, often created by non-technical users, pose significant risks, including regulatory breaches. As shadow AI continues to proliferate, security teams must take immediate action to uncover these hidden risks before they lead to data exposure and costly breaches.
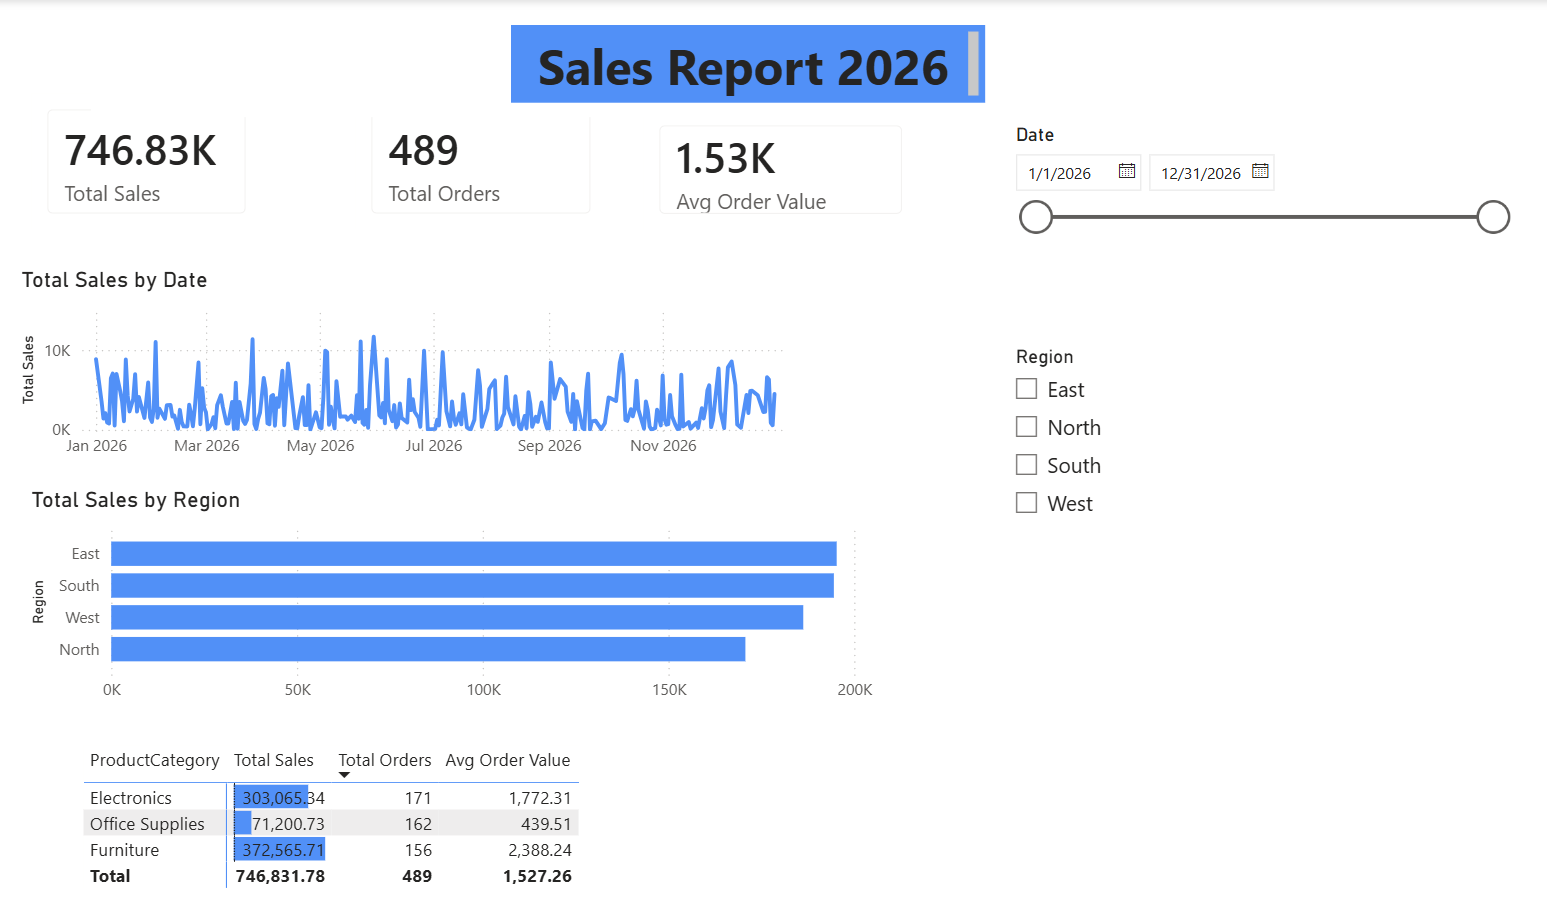
From raw data to interactive dashboard: build your first Power BI report
Welcome to our Power BI tutorial, where you’ll transform a raw data file into a polished, published report. This guide will walk you through the entire process, from initial data queries to deploying your finished dashboard in the cloud. You’ll learn to create an interactive dashboard that not only visualizes your data effectively but also includes essential features like alerts and automatic refresh settings. By the end, you’ll have the skills to empower your data storytelling and enhance your decision-making. Let's dive in and explore!
Building Local-First Web Apps Without the Hype
In 2026, the landscape of web development is evolving, and local-first applications are at the forefront of this transformation. This perspective offers seasoned developers an honest look at the architecture of local-first web apps, addressing common skepticism surrounding quick fixes and silver bullets. By exploring the benefits and challenges of this approach, we aim to empower developers to navigate the complexities of modern web architecture with confidence. Join us in discovering how local-first strategies can enhance user experiences and redefine productivity in web development.

Explore how a single command can turn any open-source repo into an AI agent backdoor.
Researchers at the University of Hong Kong have unveiled CLI-Anything, a groundbreaking tool that transforms any open-source repository into an AI agent interface with a single command. While it enables seamless integration for tools like Claude Code and GitHub Copilot CLI, it also exposes critical vulnerabilities within the software supply chain. The lack of detection capabilities for malicious instructions embedded in AI skills signifies a structural gap in current security measures.

An Open Standard's Design Flaw Demands a Smarter Approach to AI Security
A recent investigation by OX Security has unveiled a significant flaw in the Model Context Protocol (MCP), which impacts an estimated 200,000 servers. This vulnerability stems from the STDIO transport, allowing malicious command execution without input sanitization. Despite Anthropic's characterization of this behavior as intentional, experts warn that it presents a critical security risk. With numerous affected products and high-severity CVEs identified, organizations must urgently assess their MCP deployments. Essential steps to evaluate exposure, patch vulnerabilities, and implement necessary safeguards are outlined.

Sharpen Your Python Skills with 400 Targeted Practice Exercises
Elevate your Python skills with "400+ Python Practice Exercises by Topic (2026)." This comprehensive resource features 136 free exercises and 298 premium ones, all designed to enhance your coding proficiency. Organized by topic and difficulty, these exercises can be solved directly in your browser, making practice both convenient and engaging. Additionally, the guide provides strategies for effective practice and highlights top external platforms for coding challenges. Embrace the opportunity to transform your Python journey through targeted, hands-on experience.
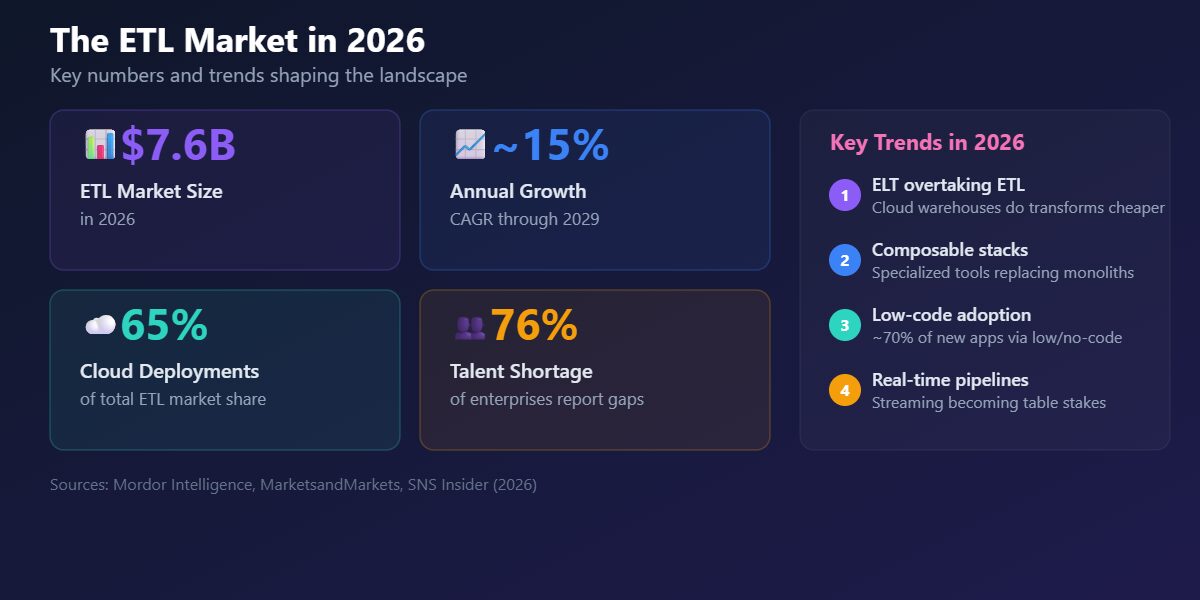
Your Data Pipeline Deserves More Than an Overcrowded Tool List
Choosing the right ETL tools is crucial when building a robust data stack, yet the abundance of overlapping options can be overwhelming. In 2026, the landscape continues to evolve, making it essential to understand which tools align with your specific needs. This practical guide not only highlights the best ETL tools available but also provides clear code examples to facilitate your decision-making process.
Building confidence evaluators for local AI: lessons from the trenches
In building **Autodidact**, a local-first AI agent framework, I've focused on a confidence evaluator that determines when to rely on local models versus escalating queries to cloud-based solutions. Key lessons learned during development include the pitfalls of grounding self-assessments in retrieved content, the variability of self-assessment prompts across different models, and the importance of ensuring retrieval quality.
How Amazon reviews reveal the real behavior behind the data
In an extensive analysis of 571 million Amazon reviews from 2023, the McAuley Lab's dataset reveals fascinating insights into consumer behavior across categories. Video games emerged as the rowdiest category, with 6.54% of reviews featuring strong profanity, starkly contrasting with the more subdued Gift Cards at 1.19%. Subscription Boxes ranked as the angriest category, while the longest recorded exclamation mark run reached an astonishing 10,594. This exploration highlights how emotional engagement varies by product type, offering a unique lens into user experiences and sentiments.

DeepSeek reemerges with powerful AI at a fraction of the cost
DeepSeek-V4 has arrived, marking a significant leap in AI capabilities with its 1.6-trillion-parameter Mixture-of-Experts model, available at just 1/6th the cost of competitors like GPT-5.5 and Claude Opus 4.7. This latest release, rooted in innovative architecture and a commitment to open-source accessibility, empowers developers and enterprises to harness advanced AI without prohibitive costs. As DeepSeek researcher Deli Chen emphasizes, "AGI belongs to everyone," positioning this model as a game changer in the landscape of affordable, high-performance AI
From First Prompt to Production AI in Under a Year
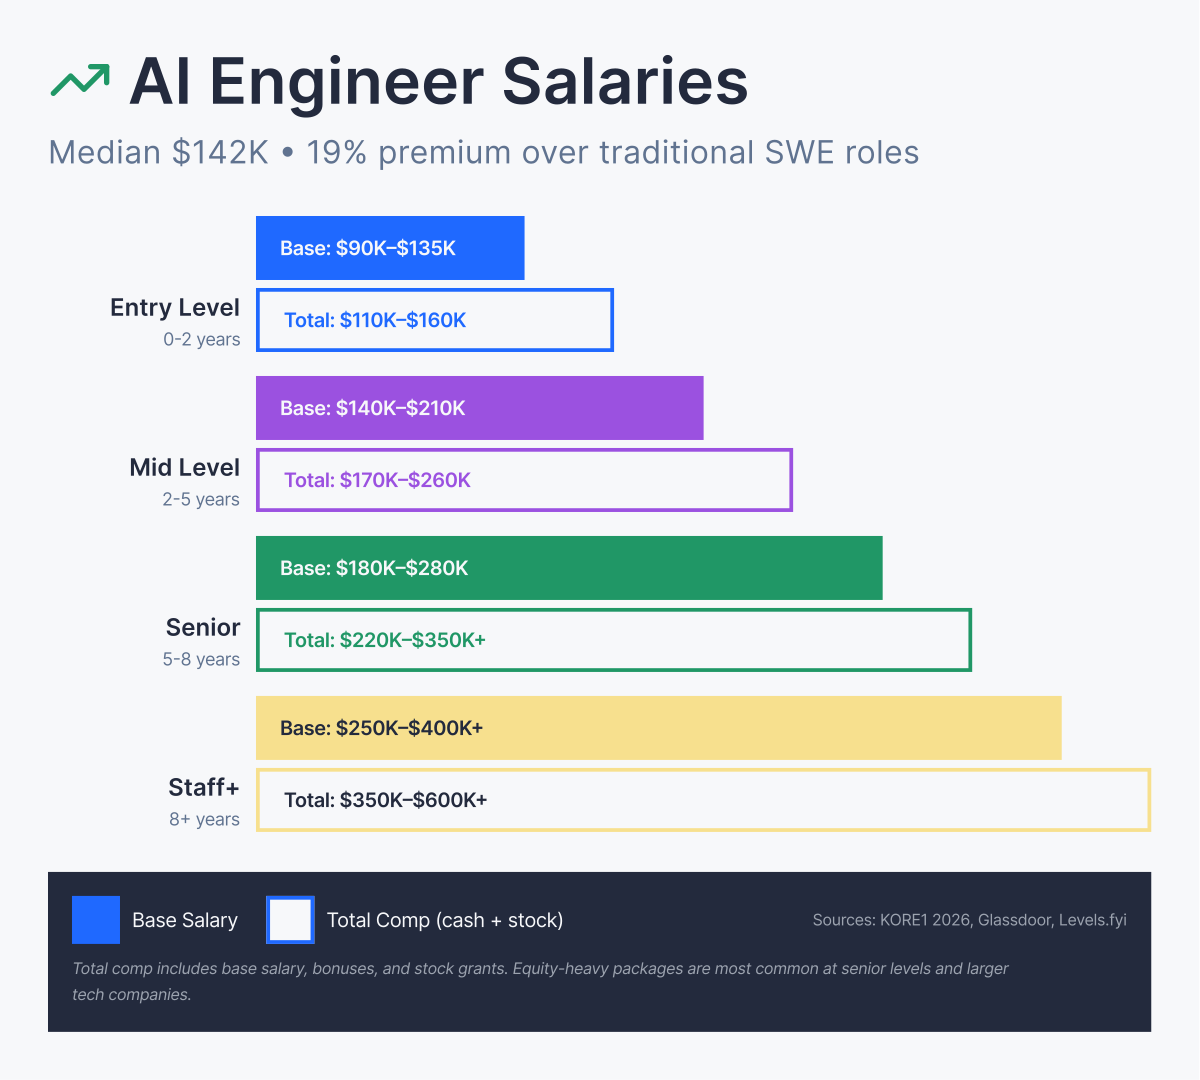
This comprehensive roadmap outlines the essential skills you need to acquire, such as Python, LLM APIs, RAG, and agents, presented in a logical learning sequence. With a realistic timeline of 8 to 12 months to transition from your first LLM prompt to deploying production AI systems, you'll also discover current salary expectations ranging from $130K to $250K+, depending on your experience.
Stop Hiding Duplicates in Your Reconciliations With Vertical Netting
If you're frustrated with Excel reconciliations that claim to be "MATCHED" while hiding duplicates and missing entries, it's time to explore a new approach. After a decade of experience in FP&A, I developed **Vertical Netting**, a framework designed to identify discrepancies that standard methods overlook. By reframing reconciliation as a summation problem rather than a simple comparison, this method ensures accuracy and clarity. Join me in discovering how to transform your reconciliation process and achieve true data integrity.

One prompt, three AI agents: secrets spilled from your CI/CD pipeline.
A recent security disclosure reveals a critical vulnerability in three AI coding agents, exposing sensitive secrets via a prompt injection attack. Researcher Aonan Guan, alongside colleagues from Johns Hopkins University, demonstrated how a single malicious instruction infiltrated Anthropic’s Claude Code Security Review, Google’s Gemini CLI Action, and GitHub’s Copilot Agent. This incident highlights systemic risks in AI agent design, particularly around access to secrets and the lack of comprehensive safeguards.
Move Beyond Accuracy: Read the Confusion Matrix to Know What Your Model Gets Right
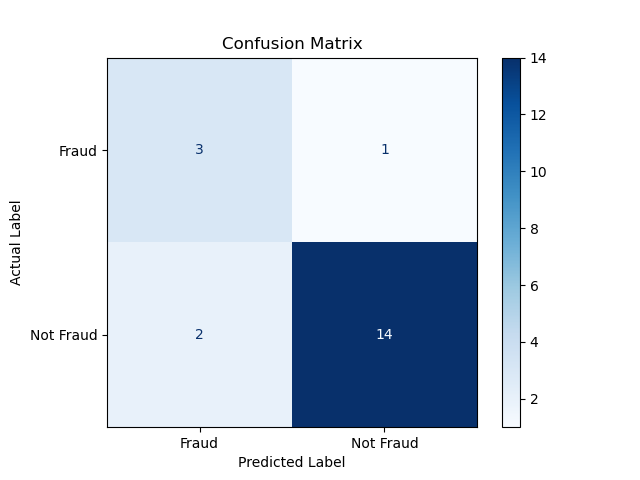
A confusion matrix in machine learning is essential for distinguishing between perceived success and actual performance. For instance, you may have trained a classification model to detect credit card fraud that boasts a 98% accuracy rate, leaving stakeholders excited. However, the reality could be starkly different if the model simply labels every transaction as legitimate. Understanding the confusion matrix allows you to critically evaluate your model's effectiveness, revealing insights that empower you to enhance its predictive capabilities and ensure reliable outcomes.

Zero trust expands as AI agents demand action-level security controls
At RSAC 2026, industry leaders converged on a critical issue: the need for enhanced security in AI agents. Four keynote speakers, including Cisco's Jeetu Patel and CrowdStrike's George Kurtz, emphasized that zero trust must evolve to continuously verify agent actions, not just initial authentication. Two innovative architectures emerged, each addressing the "monolithic agent problem" differently. Anthropic's Managed Agents isolate credentials entirely, while Nvidia's NemoClaw employs layered security. Together, they reveal a pressing need for governance and robust security measures to mitigate risks in AI deployments.
Transform your tax data into clear eligibility charts with the right table setup.
To create the chart you're envisioning, you'll need a straightforward table structured with eight rows of data. Each row should start at zero income, followed by two plateau income values, and conclude with a phaseout leading to a maximum income eligibility. This setup allows for a clear visual representation of income transitions. For added clarity, consider referencing interactive elements from the Tax Policy Center for detailed insights.
Automate Data Reactions: SQL Triggers That Work for You
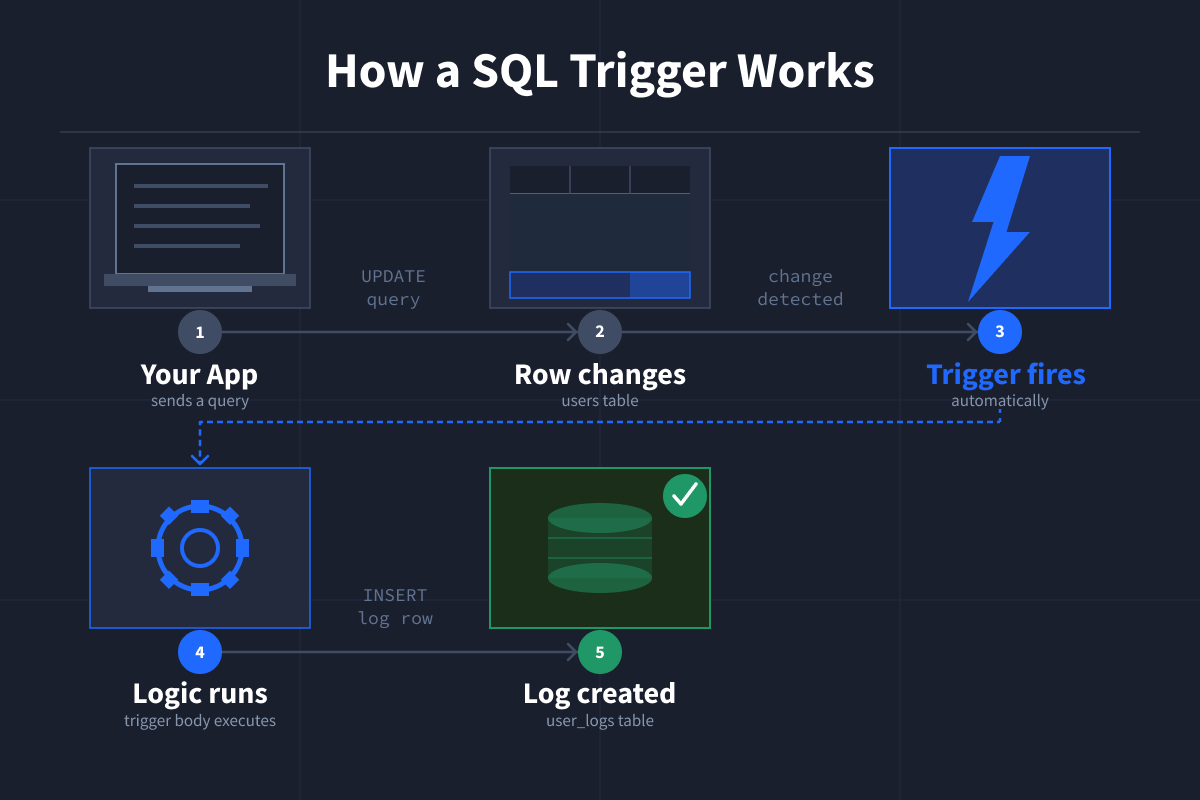
SQL triggers are powerful mechanisms that automatically execute a predefined action in response to specific data changes within a database. These actions occur during INSERT, UPDATE, or DELETE events, allowing your database to react dynamically to modifications. For instance, you can log an entry when a new row is added or update a timestamp when a record changes. By leveraging triggers, you enhance data integrity and automate workflows, making your database more responsive and efficient in handling real-time data updates.
Transform Your Filters to Distinguish Blank Cells from True Zeros
When utilizing the filter function in spreadsheets, it's essential to manage how blank and zero values are handled. In this case, you want a formula that returns a blank cell for empty records and a zero for actual zero values, without confusing them. Your current solution, `=filter(range, condition*condition*condition)`, retrieves zeros instead of blanks for empty records. Since manual adjustments are impractical for your extensive and dynamic dataset, let’s explore ways to refine your filtering approach to meet these requirements effectively.
Explore a smarter way to surface missing data in your sales analysis.
When working with pivot tables, displaying rows for categories without sales data can be challenging, especially when certain categories, like Consulting for New Zealand, are missing from the source data. To address this, consider creating a custom table with your product categories as row headings: Phone, Consulting, and Internet. You can then utilize XLOOKUP or SUMIF functions to accurately retrieve sales amounts from your pivot tables. This approach ensures that all categories are represented, providing a clearer picture of your sales landscape.
Forecasting IPO Listing Day Moves with Accessible Machine Learning
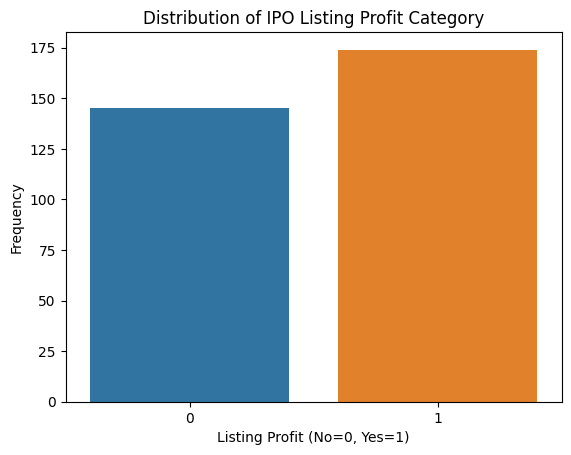
In the dynamic world of initial public offerings (IPOs), predicting listing gains is crucial for investment firms managing multiple listings annually. Speculation abounds as companies set their initial prices, but the market's verdict on listing day can significantly impact capital allocation. This project tutorial explores how to leverage TensorFlow to forecast IPO performance, turning uncertainty into informed decision-making. By harnessing advanced machine learning techniques, you can enhance your investment strategies, minimize costly miscalculations, and fully capitalize on market opportunities.
Automate conditional sums between zero markers in your spreadsheets
To automate the process of summing numerical data in Excel, you can leverage the relationship between two columns: F, containing your numerical entries, and G, which includes zeroes. The goal is to calculate totals for entries in Column F that lie between adjacent zeroes in Column G and display these sums in Column H. For instance, if the values 4 and 3 are found between two zeroes in Column G, their sum of 7 will be placed in Column H directly above the second zero.
From Messy Survey Data to a Predictive Salary Model in Two Steps
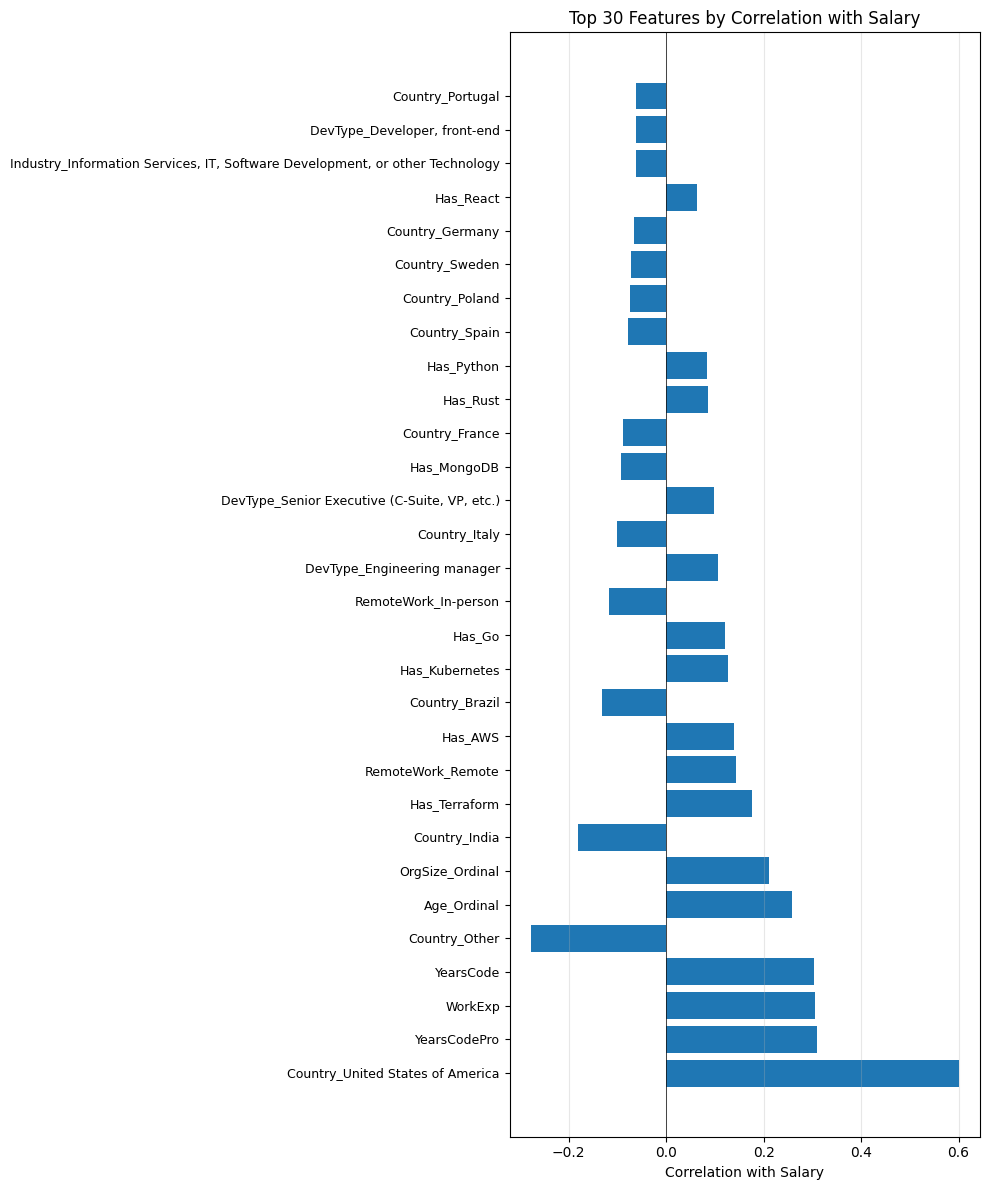
In Part 2 of our tutorial series on predicting tech salaries with machine learning, we build upon the clean, fully numeric dataset created from the 2023 Stack Overflow Developer Survey. With 75 features and nearly 15,000 rows, we are well-equipped to dive into model development. This segment will guide you through selecting the right algorithms, evaluating performance, and refining predictions. Join us as we transform data insights into actionable salary forecasts, empowering you to navigate the evolving tech landscape with confidence.