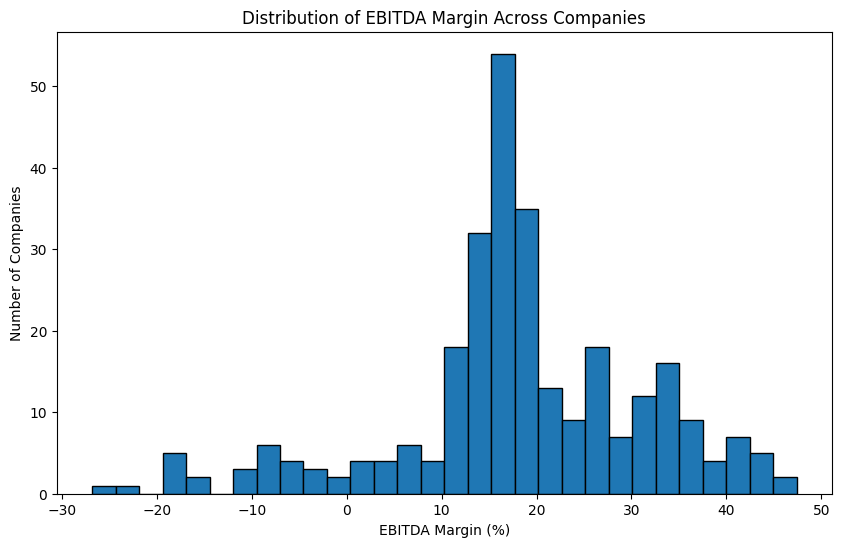
The shift from static spreadsheets to live APIs is not a minor workflow improvement. It is a fundamental change in how financial analysis gets done. Pulling data from Nasdaq's API with a few lines of Python replaces hours of manual downloading, cleaning, and updating. That is a real productivity gain, and it is available to anyone willing to write a bit of code.
For most spreadsheet users, the familiar grid of rows and columns has a hidden cost. Every time you refresh a downloaded file, you introduce the risk of stale data, formatting errors, or broken formulas. APIs eliminate that friction. They deliver structured data directly into your environment, whether you are working in Python, a notebook, or an AI-native tool that understands the query. This tutorial demonstrates exactly that: connect to the API, pull the dataset, and start analyzing immediately. The barrier is lower than most people assume. You do not need to be a software engineer. You need to be curious enough to try a new approach.
What this means in practice is that financial professionals can spend less time managing data and more time interpreting it. The same dataset that once required a subscription and a scheduled download can now arrive fresh in seconds. For teams building internal dashboards or automated reports, this is transformative. For individual analysts, it opens the door to exploring questions that were previously too time-consuming to ask. The API does not just make data accessible; it makes exploration cheap and fast.
Our view is clear: APIs are the natural next step for anyone who has felt constrained by the limits of spreadsheet-based workflows. The tutorial is a practical starting point. Run the code. See how quickly you can pull real financial data. Then ask yourself whether going back to manual downloads makes sense anymore.