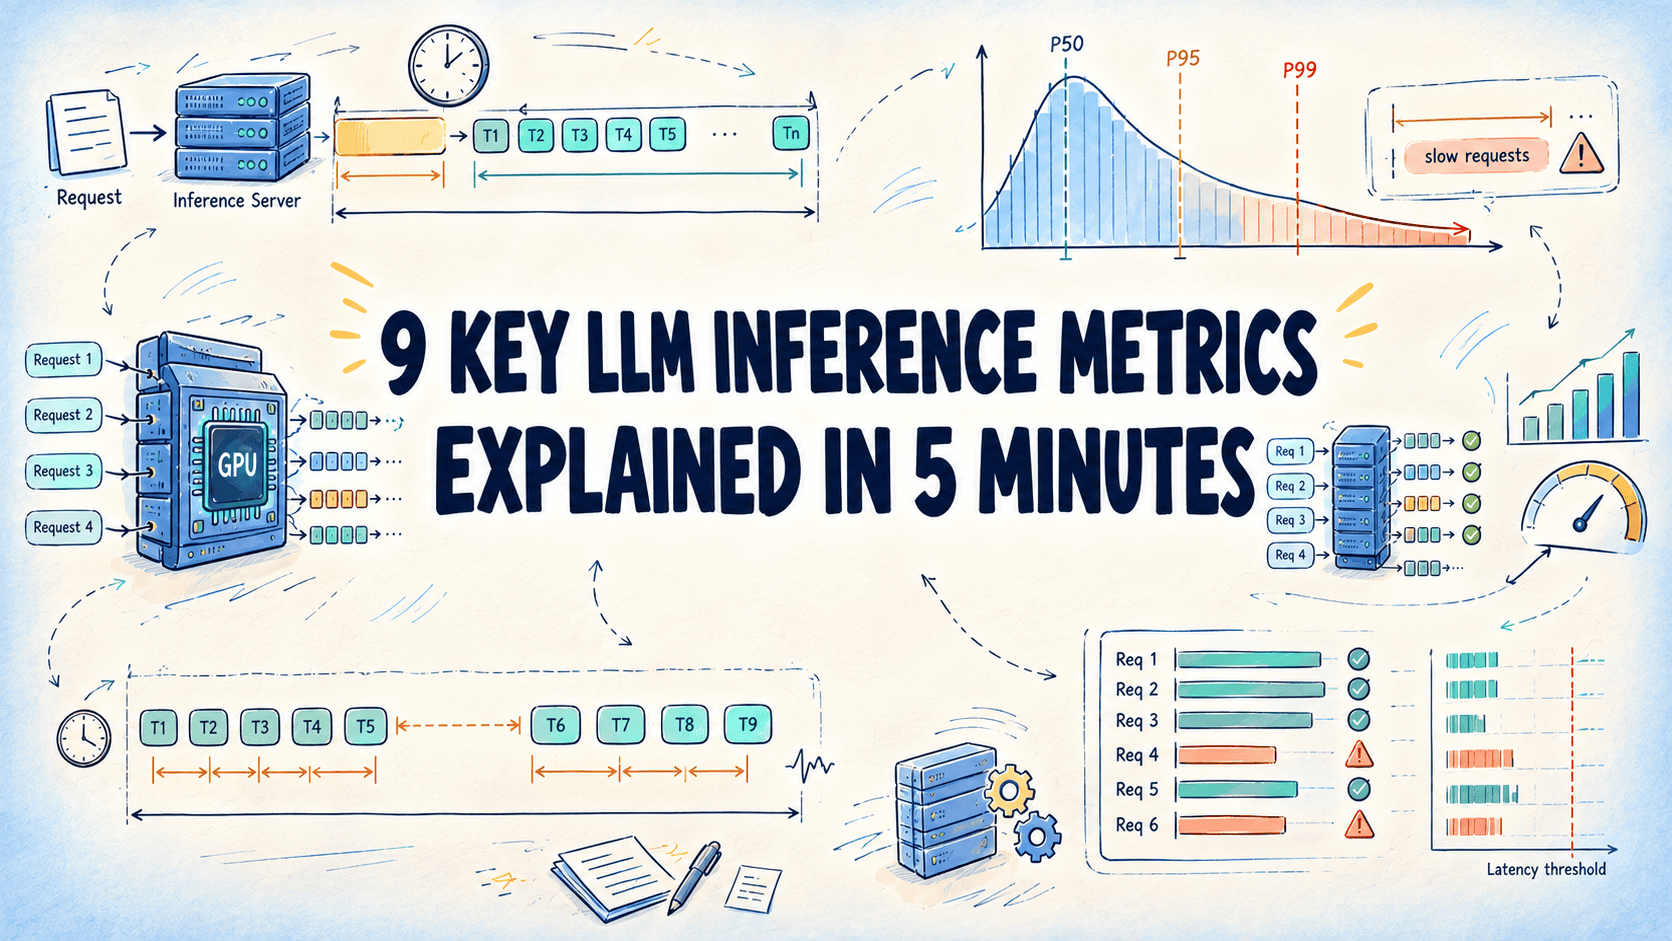
The race to deploy large language models in production has created a curious blind spot: teams obsess over model accuracy while treating inference performance as an afterthought. That is a mistake, and it is one you can fix by learning to measure what actually matters. The metrics for LLM inference, latency, token generation speed, and system load, are not academic curiosities. They are the difference between a prototype that impresses in a demo and a product that frustrates users under real traffic.
This is not a theoretical concern. Consider what Three Models, One Recipe, Three Very Different Performance Stories revealed: the same fine-tuning recipe applied to different open-weight models produced wildly different outcomes. If your inference pipeline cannot keep pace with the model you choose, you are leaving performance on the table. And when something goes wrong, the debugging process itself needs instrumentation. How Gearset replaced guesswork in queue debugging with OpenTelemetry tracing showed that distributed tracing can turn chaotic queue failures into solvable problems. The same principle applies here: you cannot optimize what you do not measure.
The practical takeaway is straightforward. Latency tells you how long a single request takes from submission to first token, which is the number that affects user perception of responsiveness. Token generation speed, measured in tokens per second, reveals how quickly your model can produce output once it starts. System load metrics, throughput, concurrent requests, queue depth, determine whether your infrastructure can handle the traffic your users actually send. Ignore any one of these, and you are flying blind. A model that generates tokens at blazing speed but requires thirty seconds of pre-processing latency is not fast; it is deceptive.
What makes these metrics essential is that they force you to think about the entire pipeline, not just the model. The same inference engine can behave differently depending on batch size, hardware configuration, and request pattern. The open-source profiling work described in Open-source profiling scales across the internet with Pinterest and Intel demonstrates that production profiling at scale is no longer a luxury reserved for tech giants. You can instrument your inference stack today. The question is whether you will treat these numbers as a one-time check or as a continuous signal that guides your decisions. The teams that build the best user experiences will be the ones that watch these metrics daily, not just during launch week.