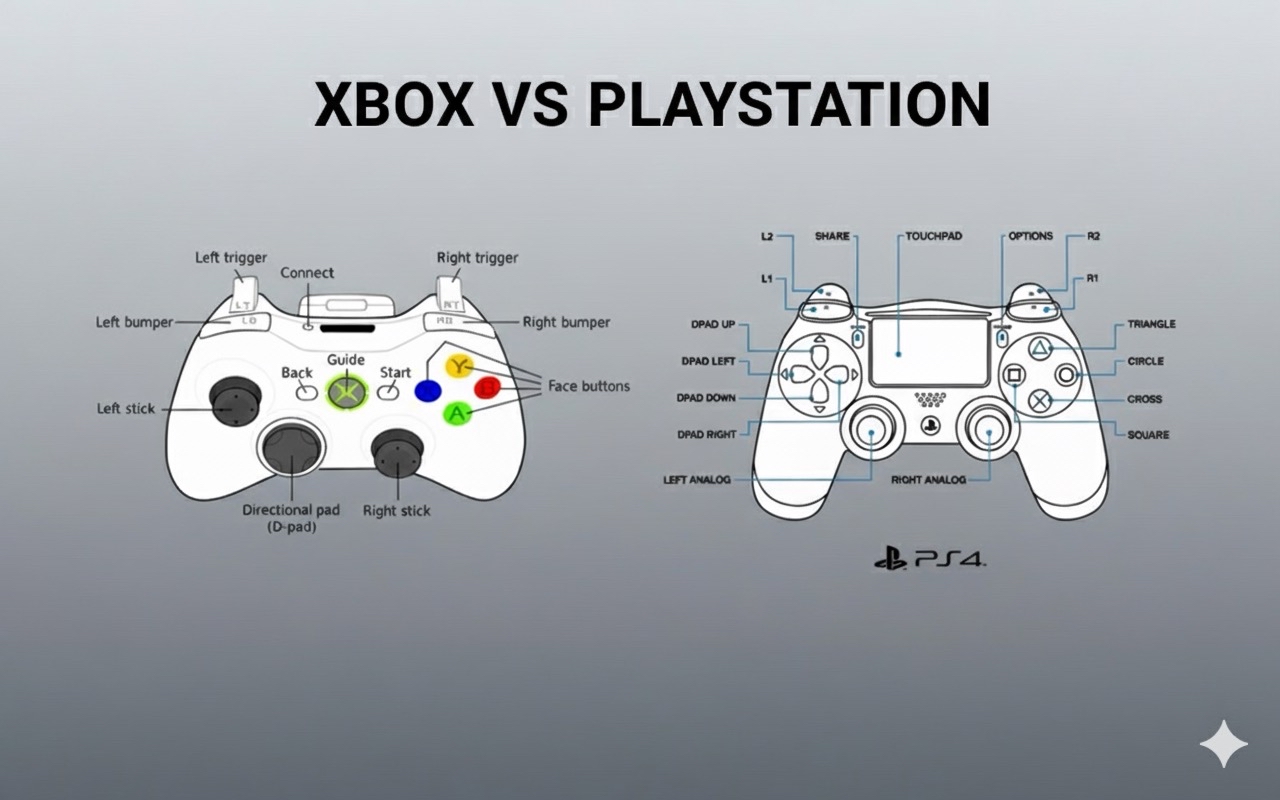
The Gamepad API has been sitting in browsers for years, quietly capable and almost entirely ignored. That's a shame, because the problem it solves, reading physical controller input, is real, and the solution it offers is solid. The real barrier has never been the API itself; it's been the invisibility of the feedback loop. When you press a button on a keyboard, you see the character appear. When you move a mouse, the cursor moves. But plug in a controller, and you get silence. No visual confirmation. No developer panel. Just numbers in a console log that you have to interpret blind.
This is where CSS Layers enter the picture in a surprisingly practical way. You can build a reusable visual debugger that renders controller state directly in the browser window, using CSS to layer button states, stick positions, and trigger values into a clean, real-time interface. No extra tools. No third-party libraries. Just the API, some HTML, and CSS that handles the visual organization. The insight here is that the debugger itself becomes a development tool you can drop into any project, and it works because CSS Layers let you manage the rendering without polluting your application's styles. It's a small, specific solution to a problem that has quietly frustrated developers for years.
For anyone building interactive web experiences, games, simulations, accessibility tools, this approach changes the workflow. Instead of guessing whether a controller is connected or whether a button press is registering, you get instant visual feedback. You can see the dead zones on the analog sticks. You can confirm that the trigger registers as an analog axis, not a binary button. You can catch the edge cases where the browser reports a disconnected controller as still present. The debugger makes the invisible visible, and that visibility is what turns the Gamepad API from a theoretical capability into a practical tool you can actually rely on.
Our opinion is straightforward: the Gamepad API deserves more use, and the lack of feedback has been the single biggest reason developers avoid it. This CSS-based debugger removes that obstacle. Build it once, drop it into your projects, and you will never again wonder whether the controller is working or your code is broken. That is the kind of tool that makes a forgotten API feel newly useful, not because the API changed, but because someone finally gave you a window into it.